
The Challenge of the Last Few Percent: Quantifying the Costs & Emissions Benefits of a 100% Renewable U.S. Electricity System
Only two decades ago, some scientists were skeptical we could integrate more than about 20% renewable energy generation on the U.S. power grid. But we hit that milestone in 2020 — so, these days, experts’ sights are set on finding pathways toward a fully renewable national power system. And according to new research published in Joule, the nation could get a long way toward 100% cost-effectively; it is only the final few percent of renewable generation that cause a nonlinear spike in costs to build and operate the power system.
In “Quantifying the Challenge of Reaching a 100% Renewable Energy Power System for the United States,” analysts from the U.S. Department of Energy’s (DOE’s) National Renewable Energy Laboratory (NREL) and DOE’s Office of Energy Efficiency and Renewable Energy (EERE) evaluate possible pathways and quantify the system costs of transitioning to a 100% renewable power grid for the contiguous United States. The research was funded by EERE’s Strategic Analysis Team.
“Our goal was to robustly quantify the cost of a transition to a high-renewable power system in a way that provides electric-sector decision-makers with the information they need to assess the cost and value of pursuing such systems,” said Wesley Cole, NREL senior energy analyst and lead author of the paper.
Expanding on previous work to simulate the evolution of the U.S. power system at unprecedented scale, the authors quantify how various assumptions about how the power system might evolve can impact future system costs. They show how costs can increase nonlinearly for the last few percent toward 100%, which could drive interest in non-electric-sector investments that accomplish similar decarbonization objectives with a lower total tab.
“Our results highlight that getting all the way to 100% renewables is really challenging in terms of costs, but because the challenge is nonlinear, getting close to 100% is much easier,” Cole said. “We also show how innovations such as lower technology costs, or alternate definitions for 100% clean energy such as including nuclear or carbon capture, can lower the cost of reaching the target.”
Advanced Methods Expand Our Understanding of High-Renewable Grids
This work builds on another Joule article released last month exploring the key unresolved technical and economic challenges in achieving a 100% renewable U.S. electricity system. While some aspects of 100% renewable power grids are well established, there is much we do not know. And because 100% renewable grids do not exist at the scale of the entire United States, we rely on models to evaluate and understand possible future systems.
“With increasing reliance on energy storage technologies and variable wind and solar generation, modeling 100% renewable power systems is incredibly complex,” said Paul Denholm, NREL principal energy analyst and coauthor of the paper. “How storage was used yesterday impacts how it can be used today, and while the resolution of our renewable resource data has improved tremendously in recent years, we can’t precisely predict cloudy weather or calm winds.”
Integrated energy pathways modernizes our grid to support a broad selection of generation types, encourages consumer participation, and expands our options for transportation electrification.
Many prior studies have modeled high-renewable electricity systems for a variety of geographies, but not many examine the entire U.S. grid. And even fewer studies attempt to calculate the cost of transitioning to a 100% renewable U.S. grid — instead, they typically present snapshots of systems in a future year without considering the evolution needed to get there. This work expands on these prior studies with several important advances.
First, the team used detailed production cost modeling with unit commitment and economic dispatch to verify the results of the capacity expansion modeling performed with NREL’s publicly available Regional Energy Deployment System (ReEDS) model. The production cost model is Energy Exemplar’s PLEXOS, a commercial model widely used in the utility industry.
“Over the past couple of years we put a tremendous amount of effort into our modeling tools to give us confidence in their ability to capture the challenges inherent in 100% renewable energy power systems,” Cole said. “In addition, we also tried to consider a broad range of future conditions and definitions of the 100% requirement. The combination of these efforts enables us to quantify the cost of a transition to a 100% clean energy system far better than we could in the past.”
The analysis represents the power system with higher spatial and technology resolution than previous studies in order to better capture differences in technology types, renewable energy resource profiles, siting and land-use constraints, and transmission challenges. The analysis also uniquely captures the ability to retrofit existing fossil plants to serve needs under 100% renewable scenarios and assesses whether inertial response can be maintained in these futures.
What Drives System Costs? Transition Speed, Capital Costs, and How We Define 100%
The team simulated a total of 154 different scenarios for achieving up to 100% renewable electricity to determine how the resulting system cost changes under a wide range of future conditions, timeframes, and definitions for 100% — including with systems that allow nonrenewable low-carbon technologies to participate.
“Here we use total cumulative system cost as the primary metric for assessing the challenge of increased renewable deployment for the contiguous U.S. power system,” said Trieu Mai, NREL senior energy analyst and coauthor of the paper. “This system cost is the sum of the cost of building and operating the bulk power system assets out to the year 2050, after accounting for the time value of money.”
To establish a reference case for comparison, the team modeled the system cost at increasing renewable energy deployment for base conditions, which use midrange projections for factors such as capital costs, fuel prices, and electricity demand growth. Under these conditions, the least-cost buildout grows renewable energy from 20% of generation today to 57% in 2050, with average levelized costs of $30 per megawatt-hour (MWh). Imposing a requirement to achieve 100% renewable generation by 2050 under these same conditions raises these costs by 29%, or less than $10 per MWh. System costs increase nonlinearly for the last few percent approaching 100%
Associated with the high renewable energy targets are substantial reductions in direct carbon dioxide (CO2) emissions. From the 57% least-cost scenario, the team translated the changes in system cost and CO2 emissions between scenarios into an average and incremental levelized CO2 abatement cost. The average value is the abatement cost relative to the 57% scenario, while the incremental value is the abatement cost between adjacent scenarios, e.g., between 80% and 90% renewables. In other words, the average value considers all the changes, while the incremental value considers only the change over the most recent increment.

Total bulk power system cost at a 5% discount rate (left) for the seven base scenarios and levelized average and incremental CO2 abatement cost (right) for those scenarios. The 2050 renewable (RE) generation level for each scenario is listed on the x-axis. The system costs in the left figure are subdivided into the four cost categories listed in the figure legend (O&M = operations and maintenance). The purple diamond on the y-axis in the left plot indicates the system cost for maintaining the current generation mix, which can be used to compare costs and indicates a system cost comparable to the 90% case.

Total bulk power system cost at a 5% discount rate (left) for the seven base scenarios and levelized average and incremental CO2 abatement cost (right) for those scenarios. The 2050 renewable (RE) generation level for each scenario is listed on the x-axis. The system costs in the left figure are subdivided into the four cost categories listed in the figure legend (O&M = operations and maintenance). The purple diamond on the y-axis in the left plot indicates the system cost for maintaining the current generation mix, which can be used to compare costs and indicates a system cost comparable to the 90% case. NREL
Notably, incremental abatement costs from 99% to 100% reach $930/ton, driven primarily by the need for firm renewable capacity — resources that can provide energy during periods of lower wind and solar generation, extremely high demand, and unplanned events like transmission line outages. In many scenarios, this firm capacity was supplied by renewable-energy-fueled combustion turbines, which could run on biodiesel, synthetic methane, hydrogen, or some other renewable energy resource to support reliable power system operation. The DOE Energy Earthshots Initiative recently announced by Secretary of Energy Jennifer M. Granholm includes the Hydrogen Shot, which seeks to reduce the cost of clean hydrogen by 80% to $1 per kilogram in one decade — an ambitious effort that could help reduce the cost of providing renewable firm capacity.
“When achieving a 100% renewable system, the costs are significantly lower if there is a cost-effective source of firm capacity that can qualify for the 100% definition,” Denholm said. “The last few percent cannot cost-effectively be satisfied using only wind, solar, and diurnal storage or load flexibility — so other resources that can bridge this gap become particularly important.”
Capital costs are the largest contributor to system costs at 100% renewable energy. Future changes in the capital costs of renewable technologies and storage can thus greatly impact the total system cost of 100% renewable grids. The speed of transition is also an important consideration for both cost and emission impacts. The scenarios with more rapid transitions to 100% renewable power were more costly but had greater cumulative emissions reductions.
“Looking at the low incremental system costs in scenarios that increase renewable generation levels somewhat beyond the reference solutions to 80%–90%, we see considerable low-cost abatement opportunities within the power sector,” Mai said. “The trade-off between power-sector emissions reductions and the associated costs of reducing those emissions should be considered in the context of non-power-sector opportunities to reduce emissions, which might have lower abatement costs — especially at the higher renewable generation levels.”
“The way the requirement is defined is an important aspect of understanding the costs of the requirement and associated emissions reduction,” Cole said. “For instance, if the 100% requirement is defined as a fraction of electricity sales, as it is with current state renewable polices, the cost and emissions of meeting that requirement are similar to those of the scenarios that have requirements of less than 100%.”
Additional Research Can Help the Power Sector Understand the Path Forward
While this work relies on state-of-the-art modeling capabilities, additional research is needed to help fill gaps in our understanding of the technical solutions that could be implemented to achieve higher levels of renewable generation, and their impact on system cost. Future work could focus on key considerations such as the scaling up supply chains, social or environmental factors that could impact real-world deployment, the future role of distributed energy resources, or how increased levels of demand flexibility could reduce costs, to name a few.
“While there is much left to explore, given the energy community’s frequent focus on using the electricity sector as the foundation for economy-wide decarbonization, we believe this work extends our collective understanding of what it might take to get to 100%,” Cole said.
Learn more about NREL’s energy analysis and grid modernization research.
Article courtesy of the NREL, the U.S. Department of Energy


Environment
First savings hits Navee XT5 Pro long-range off-road e-scooter for $1,400, Anker SOLIX 60,000mAh power station $108, Lectric, more


Our mid-week Green Deals is headlined by a surprise first-ever holiday deal on the brand-new Navee XT5 Pro Long-Range Off-Road Electric Scooter at $1,400, which boasts some serious premium upgrades. Right behind it, we have Anker’s SOLIX C200 DC Compact Power Station, and its larger C300 counterparts, that start from $108, as well as a roundup of Lectric’s three e-bikes getting up to $500 price cuts and $220 bundles that start from $1,399, Bluetti’s current 48-hour Christmas flash sale through December 18, and much more waiting for you below. And don’t forget about the hangover deals that are collected together at the bottom of the page, like yesterday’s Velotric Christmas e-bike Gift Season Sale, the new $999 low on Heybike’s dual-battery Hauler cargo e-bike, and more.
Head below for other New Green Deals we’ve found today and, of course, Electrek’s best EV buying and leasing deals. Also, check out the new Electrek Tesla Shop for the best deals on Tesla accessories.
First savings just hit Navee’s newest feature-packed XT5 Pro long-range off-road electric scooter for $1,400
Navee’s official Amazon storefront is undercutting the brand’s direct Christmas Sale pricing on its brand-new XT5 Pro Long-Range Off-Road Electric Scooter for $1,399.99 shipped, after clipping the on-page $200 off coupon. This model just hit the market early last month with a $1,500 price tag, which is where it’s still priced direct from the brand. At Amazon, however, it started off priced at $1,700 and dropped to $1,600 right before Black Friday, with today’s deal being the first official chance at cash savings that we’ve spotted. While this deal lasts, you’re getting $100 off the going rate that sets the bar for future discounts, while also upgrading your commutes/joyrides with the brand’s take on a superscooter.
The most high-end of Navee’s e-scooter lineup that even outpaces the flagship ST3 Pro, this new XT5 Pro Long-Range Electric Scooter is an off-roading superscooter that comes with bolstered durability from its carbon steel frame, while also being the second series to boast the brand’s unique damping arm suspension system. It arrives equipped with a 750W motor that can peak as high as 2,200W for seriously monstrous power, with the entire thing powered by a 596.7Wh battery. This combination gives it a travel range of up to 46.6 miles on a single six-hour charge (with a 1.5-hour flash charging feature available), maxing out at 31 MPH top speeds for the thrill seekers amongst you. It even comes with an add-on option through a 468Wh external battery (sold separately) that increases the mileage with up to 34 miles of extra travel.
As Navee’s XT5 Pro electric scooter is a more premium commuter, it should be no surprise that it comes loaded with a premium array of features, including smart features like Apple Find My, Bluetooth proximity locking/unlocking, app-based setting customization, and more. Your riding experience is also further heightened by the stock features that include a triple braking system (dual front and rear disc brakes, as well as a rear regenerative EABS brake), 12-inch off-road tubeless tires, an auto-on headlight, mecha-style logo lamps in the stem, a brake-activated taillight, front and rear built-in turn signals, the brand’s traction control system, a 5-inch full color display, and much more.
As I mentioned, alongside this surprise Navee XT5 electric scooter deal, the brand also has its ongoing Christmas Sale with up to 30% discounts still going right now, which offers its e-scooters at some of the best rates starting from $200.
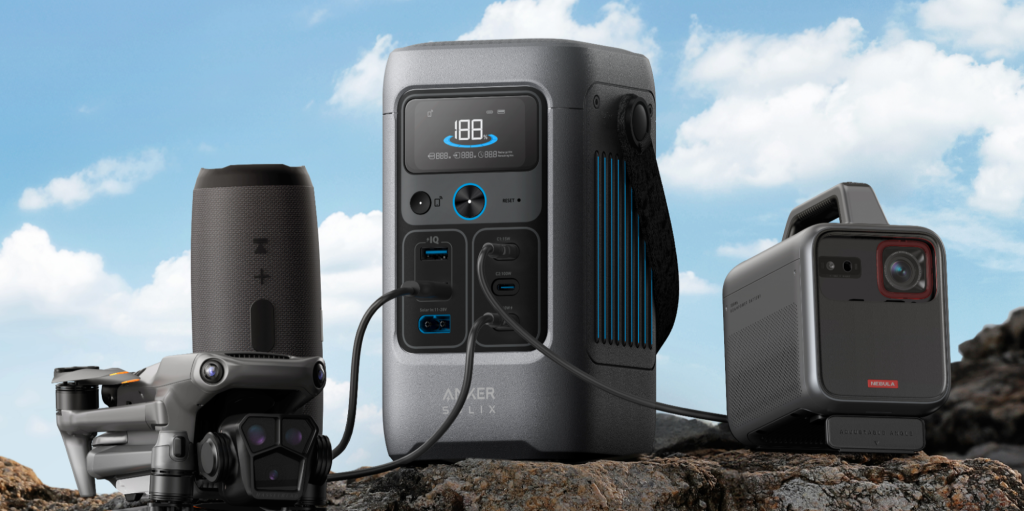
Get 60,000mAh/192Wh support for devices from Anker’s SOLIX C200 DC power station at $108 for Xmas, more from $162
As part of its ongoing Christmas Sale, Anker SOLIX is offering its C200 DC 60,000mAh/192Wh Compact Power Station at $108.49 shipped, which matches in price at Amazon while also beating out the current price of the predecessor PowerCore Reserve by $7. While it carries a $200 MSRP, you can find it starting lower at $170 at Amazon, with discounts over the year having taken the costs as low as $100, most recently during Black Friday through Cyber Monday over two weeks ago. You’re looking at the third-best price we have tracked while the $62 savings last ($92 off the MSRP), only beaten out by that $100 low and $105 rates that sporadically pop up. If you want to go bigger, you can also find the C300 DC and C300 AC 90,000mAh models starting from $162.
If you want to learn more about these compact power stations, be sure to check out our original coverage of these Christmas deals here. You can also go even larger by taking advantage of Anker’s current SOLIX Christmas Sale deals, with up to 65% discounts across its entire power station lineup that starts from $162.
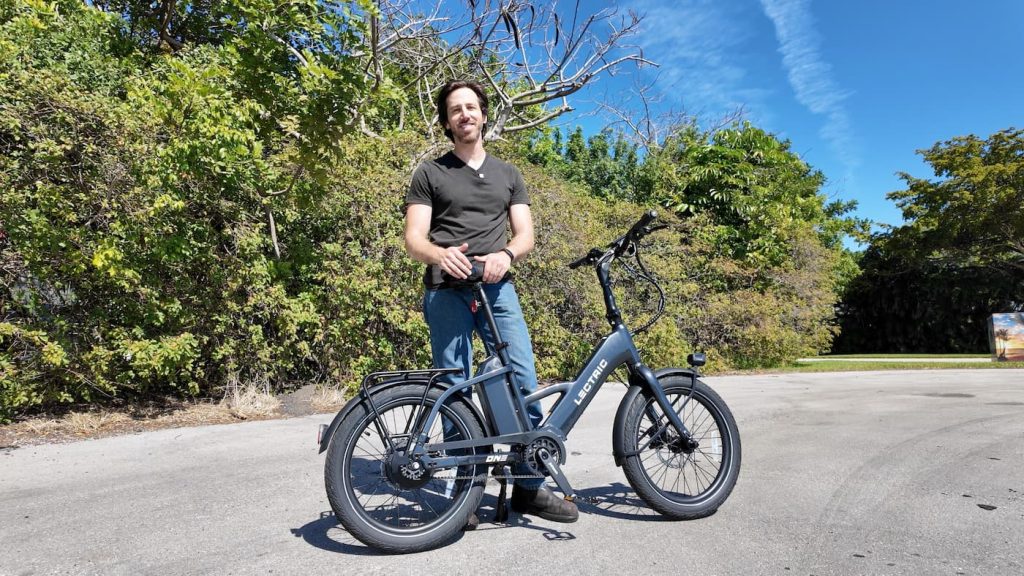
Save up to $720 on these three Lectric e-bikes with price cuts to lows starting from $1,399 for Xmas
Looking back in on Lectric’s ongoing Christmas Holiday Sale event, we wanted to shine a spotlight on the three e-bikes receiving rare price cuts over the usual free bundle packages – a first for so many models at once. The biggest of these price cuts that also retains a bundle is Lectric’s ONE e-bike Long-Range Belt-Drive Commuter e-bike with a $220 FREE bundle of gear at $1,899 shipped. This entire package would normally run you $2,619 at full price, with a repeat of the $500 price cut we’ve been seeing more frequently since Labor Day to its all-time lowest tracked price, along with a FREE rear cargo rack and fender set. While the deadline to receive it before Christmas has passed, you can still secure it and all the other e-bikes with some of their best deals to kick-off your new year with a new commuting option.
If you want to learn more about this premium e-bike, or the other models getting Christmas price cuts, be sure to check out our original coverage of these deals here, while you can also browse the brand’s full Christmas lineup here.

For 48 hours, you can pick up Bluetti’s latest Elite 10 Mini power station at a new $109 Xmas flash sale low (Save $90), more
As part of its ongoing Christmas Sale, Bluetti has a 48-hour flash sale running that is taking up to $199 off three different offers, with a notable standout in the Elite 10 Mini Power Station for $109 shipped, which sadly cannot be stacked with the exclusive 5% off savings code, but does beat out its Amazon pricing by $10. While carrying a $239 MSRP direct from the brand, you can find it starting lower at Amazon for $199, with the holiday discounts that started last week having only taken the costs down to $149, before falling to $119 and then $109 during this flash sale window. While these $90 savings ($130 off the MSRP) last through December 18, you’re able to score it at a new all-time low price, with another flash offer being two of these stations for $199 shipped.
If you want to learn more about this mini power station, or browse the full lineup of temporary deals, be sure to check out our original coverage of this flash sale here.


Best Winter EV deals!
- Velotric Nomad 2X e-bike (camo) with DELTA 3 Plus station: $3,048 (Reg. $3,298)
- Velotric Nomad 2X e-bike (sage or fig) with DELTA 3 Plus station: $2,948 (Reg. $3,298)
- Heybike Hero 750W Mid-Drive Carbon-Fiber All-Terrain e-bike: $2,099 (Reg. $3,099)
- Segway Xyber e-bike (at lowest price): $2,900 (Reg. $3,300)
- Lectric XPedition 2.0 35Ah Cargo e-bike w/ $893 bundle: $1,999 (Reg. $2,761)
- Ride1Up TrailRush German Mid-Drive e-bike: $1,995 (Reg. $2,095)
- Heybike Hero 1,000W Carbon-Fiber All-Terrain e-bike: $1,899 (Reg. $2,599)
- Tenways Wayfarer e-bike with $366 bundle: $1,899 (Reg. $2,199)
- Velotric Fold 1 Plus e-bike with DELTA 2 station: $1,898 (Reg. $2,198)
- Segway Xafari e-bike (at lowest price): $1,800 (Reg. $2,400)
- Aventon Aventure 3 Smart All-Terrain e-bike: $1,799 (Reg. $1,999)
- Aventon Aventure 3 Smart Step-Through All-Terrain e-bike: $1,799 (Reg. $1,999)
- Velotric Summit 1 Versatile Multi-Terrain e-bike w/ 160 bundle: $1,799 (Reg. $2,059)
- Lectric XPedition 2.0 26Ah Cargo e-bike w/ $744 bundle: $1,799 (Reg. $2,543)
- Lectric XP Trike2 750 Long-Range eTrike: $1,699 (Reg. $1,799)
- Aventon Level 3 Step-Over Smart Commuter e-bike: $1,699 (Reg. $1,899)
- Aventon Level 3 Step-Through Smart Commuter e-bike: $1,699 (Reg. $1,899)
- Lectric XPeak 2.0 Long-Range Off-Road e-bike: $1,599 (Reg. $1,699)
- Aventon Abound Cargo e-bike: $1,599 (Reg. $1,999)
- Ride1Up VORSA Modular Multi-Use e-bike: $1,595 (Reg. $1,695)
- Navee’s new XT5 Pro Long-Range Off-Road Electric Scooter: $1,400 (Reg. $1,500)
- Lectric XP Trike2: $1,399 (Reg. $1,499)
- Lectric XPeak 2.0 Standard Off-Road e-bike: $1,399 (Reg. $1,499)
- Lectric XPedition 2.0 13Ah Cargo e-bike with $346 bundle: $1,399 (Reg. $1,745)
- Heybike ALPHA All-Terrain e-bike with $266 bundle: $1,299 (Reg. $1,699)
- Lectric XPress 750 Commuter e-bikes with $518 bundle: $1,299 (Reg. $1,817)
- Lectric XP4 750 LR Folding Utility e-bikes with $514 bundle: $1,299 (Reg. $1,813)
- Lectric XP Lite 2.0 JW Black LR e-bike with $350 bundle: $1,099 (Reg. $1,449)
- Heybike Hauler Dual-Battery Cargo e-bike with $89+ bundle (new low): $999 (Reg. $1,413)
- Lectric XP4 Standard Folding Utility e-bikes with $227 bundle: $999 (Reg. $1,226)
- Lectric XP Lite 2.0 Long-Range e-bikes with $350 bundles: $999 (Reg. $1,349)
- Segway ZT3 Pro All-Terrain Electric Scooter: $850 (Reg. $1,000)
- Segway E3 Pro Electric Scooter: $600 (Reg. $700)

Best new Green Deals landing this week
The savings this week are also continuing to a collection of other markdowns. To the same tune as the offers above, these all help you take a more energy-conscious approach to your routine. Winter means you can lock in even better off-season price cuts on electric tools for the lawn while saving on EVs and tons of other gear.
- Get up to $562 savings on Velotric e-bikes + $100 gift card promotion for Christmas – deals start from $1,099
- Carry packages, people, more on Heybike’s 85-mile dual-battery Hauler cargo e-bike with FREE gear/gifts at a new $999 low
- Bluetti Elite 30 V2 288Wh LiFePO4 power station and its many colorways start from $204 and arrive before Xmas
- Autel’s MaxiCharger Home 40A level 2 EV charging station arrives ahead of Christmas for $319 (Reg. $470)
- Hiboy’s Christmas Sale offers EV commuting solutions at up to 50% off + bonus savings codes – all starting from $150
- Pass lawn mowing to ECOVACS’ Goat O1000 RTK robot while at a new $699 low for Xmas (Reg. $1,000)
- Off-season savings take EGO’s 56V 15-inch rapid reload string trimmer down to $149 annual low ($50 off)
- Save up to $175 on Goal Zero’s compact Yeti 700 or 500 power stations at best prices in months from $375
- Electrified Weekly – Christmas sales from Lectric, Velotric, Rad Power, Anker SOLIX, EcoFlow, Bluetti, and so much more
FTC: We use income earning auto affiliate links. More.


The Urban Cruiser is Toyota’s second fully electric SUV, but it adds some meaningful upgrades over the outgoing bZ4X.
Meet the new Toyota Urban Cruiser electric SUV
Based on a new dedicated EV platform, Toyota calls the Urban Cruiser “an authentic SUV” in terms of design and performance.
Toyota launched the new entry-level electric SUV in Europe with two lithium iron phosphate (LFP) battery pack options: 49 kWh or 61 kWh. The smaller (49 kWh) battery is only available with a 142 hp (106 kW) front-wheel-drive (FWD) motor, rated with a WLTP driving range of 344 km (214 miles).
The larger 61 kWh version is available with FWD or all-wheel drive (AWD) powertrains, delivering WLTP driving ranges of 426 km and 395 km, respectively. The AWD version delivers a combined 181 hp (135 kW).
Toyota said all Urban Cruiser variants can tow braked loads of up to 750 kg (1,650 lbs). With DC fast charging, the electric SUV can recharge from 10% to 80% in around 45 minutes.

To improve efficiency, unlock faster charging, and boost driving range, Toyota added a heat pump and battery preconditioning feature as standard.
Thanks to the new dedicated EV platform, the interior is open and spacious. With sliding and split-folding rear seats, the Urban Cruiser rivals “the load-carrying capabilities of larger SUVs,” Toyota said.


Measuring 4,285 mm long, 1,800 mm wide, and 1,640 mm tall, the electric SUV is slightly bigger than its popular Yaris Cross. It also gains extra interior space thanks to an extended wheelbase of 2,700 mm (+140 mm compared to the Yaris Cross).
The infotainment system consists of a 10.25″ driver display and a 10.1″ multimedia touchscreen with wireless Apple CarPlay and Android Auto.

All Urban Cruiser models are equipped with standard safety features such as Brake Support System, Adaptive Cruise Control, Lane Keep Assist, and Traffic Sign Recognition.
In Germany, the Urban Cruiser EV is on sale, priced from €31,990 ($37,500). Financing is available from €340.41 ($400) a month.
Toyota’s new entry-level electric SUV follows the launch of the refreshed bZ4X. In 2026, Toyota will introduce the C-HR+, bZ4X Touring, and Hilux BEV electric pickup.
For those in the US, Toyota is not expected to launch the Urban Cruiser in the States. However, the new and much-improved 2026 Toyota bZ is among the few EVs in the US with starting prices under $35,000. Next year, it will launch the C-HR, which is expected to be even more affordable.
FTC: We use income earning auto affiliate links. More.


Tesla has reportedly thrown a “Giga-Event” for its employees at Gigafactory Berlin, featuring German rapper Kool Savas. The goal? To rally the troops ahead of a critical union vote. The result? A “cringe” performance involving a Cybertruck, failed “Elon” chants, and some anti-union propaganda.
We have been covering the ongoing tensions between Tesla and IG Metall, the powerful German metalworkers’ union, for years now. While Tesla has managed to fend off a complete union takeover of the works council in the past, the union has gained ground in a vote last year, and a new election is looming.
Tesla’s strategy to counter this seems to be… distinct.
According to a new report from Handelsblatt, Tesla management organized a private “Giga-Event” on December 2 to “boost morale” and, apparently, to explicitly campaign against IG Metall.
The centerpiece of the event was a performance by famous German rapper Kool Savas. And this is where things reportedly got cringe.
Witnesses and a video provided to the German newspaper described the scene as incredibly awkward. Savas reportedly drove onto the stage in a Tesla Cybertruck, which is a rare sight in Europe, and attempted to hype up the crowd of factory workers.
The report states that the rapper tried to start an “Elon, Elon” chant, but the crowd of employees refused to join in. He changed references of ‘Mercedes’ to ‘Tesla’ in his song.
Tesla employees weren’t into it at all, and the rapper admitted after five songs:
“You guys are tough, man. You guys are really tough. Tesla, what’s wrong with you?
When the applause for Tesla as a “great employer” was lukewarm at best, Savas reportedly asked the audience if they had a “stick up their ass” (Stock im Arsch).
You can’t make this stuff up.
But it wasn’t just about a rapper struggling to read the room. The event was held with the backdrop of an upcoming work council vote.
In the last one in 2024, IG Metall managed to elect the biggest faction, but fell short of a majority.
Now, with Tesla’s sales crashing in Europe and Elon Musk’s popularity plummeting to a new low, management is scared that IG Metall could make the gains needed to control a majority of the workers’ council.
Tesla Gigafactory Berlin manager André Thierig took some shots at the union in his speech at the event, according to Handelsblatt’s report.
The good news is that he announced a 4% wage increase for employees, but he falsely claimed that they would have only gotten two if IG Metall held collective bargaining power.
On the other hand, IG, which welcomed the wage increase, claimed that Tesla needs to increase salaries by another 30% to be on par with the auto industry in Germany.
Furthermore, the report claims that Thierig suggested that Tesla’s expansion plans at the factory, including recently announced battery production, is dependent on the results of the upcoming work council election in early 2026.
IG Metall chief Otto sees a pattern at Tesla:
For years, the message has been: if you work hard, don’t join IG Metall, and dutifully elect the management-appointed works council, the factory will be expanded. Then you’ll all have unprecedented opportunities for advancement.
He sees this as a threat to control employees.
While Tesla reiterated that jobs for the 11,000 employees at Gigafactory Berlin are secured, there are growing concerns as Tesla’s sales in Europe have crashed more than 30% in 2025.
Electrek’s Take
One thing is clear: the union is having a positive impact on Tesla workers.
I doubt Tesla would be offering a 4% wage increase right before a union vote if people weren’t flirting with the idea of joining IG Metall.
What I dislike is the anti-union rhetoric. It is not needed. Let the union make its case, management make theirs, and let the employees choose. That’s it.
If you are a good employer, you don’t need to hire a rapper to tell your employees that you are a good employer.
As for job security for Tesla employees in Germany, I think there’s room for concern.
Thierig noted on stage that Model Y was still the best-selling EV in Europe, which is true, but it’s also true that sales are down 30% in Europe in 2025. And that’s compared to 2024, when sales were down 10% year-over-year.
Tesla’s situation in Europe is undeniably not great.
The automaker was expected to bring several vehicle programs to Giga Berlin, but the factory has now been operational for almost 4 years and still only produces the Model Y.
I think the only reasonable hope the factory has is the potential addition of the Tesla Semi program. Other than that, I see it shrinking rather than expanding.
FTC: We use income earning auto affiliate links. More.
-
 Sports2 years ago
Story injured on diving stop, exits Red Sox game
-
 Sports3 years ago
‘Storybook stuff’: Inside the night Bryce Harper sent the Phillies to the World Series
-
 Sports2 years ago
Game 1 of WS least-watched in recorded history
-
 Sports3 years ago
Button battles heat exhaustion in NASCAR debut
-
 Sports3 years ago
MLB Rank 2023: Ranking baseball’s top 100 players
-
Sports4 years ago
Team Europe easily wins 4th straight Laver Cup
-
 Environment3 years ago
Japan and South Korea have a lot at stake in a free and open South China Sea
-
 Environment1 year ago
Here are the best electric bikes you can buy at every price level in October 2024