
Looking Into The Future Of The Grid

Over 10,000 tracking heliostats focus solar energy at the receiver on the 640-foot power tower at the Crescent Dunes Solar Thermal Facility in Nevada. The facility is representative of concentrating solar power modeled in the Annual Technology Baseline. Photo by Dennis Schroeder, NREL.
Article courtesy of NREL.
One of the challenges of aggregating energy data from different sources into studies is knowing whether the data uses consistent assumptions. The Annual Technology Baseline (ATB) resolves this challenge by creating consistent assumptions across all electric generation technology cost and performance data.
The ATB integrates current and projected data for electricity-generation technologies into one user-friendly tool. It is led by the National Renewable Energy Laboratory (NREL), assembled by a team of analysts from the U.S. Department of Energy’s national laboratories and sponsored by the U.S. Department of Energy (DOE). Each year, new data are released, and the 2021 update of the electricity-sector ATB came out in July.
All renewable energy technologies are represented in the ATB. In this Q&A, solar power technology leads and NREL analysts—David Feldman, Chad Augustine, Parthiv Kurup, and Craig Turchi—share their insight on why the ATB is unique and what is new in terms of solar photovoltaics (PV) and concentrating solar power (CSP) in the 2021 update, including new technologies, expanded financial data, and better interoperability with other models.
Does any other resource like the ATB exist?
The ATB was created because there was no existing database with the level of nuance on technology innovation that energy analysts need. As a national laboratory dedicated specifically to renewable energy, NREL partners with Oak Ridge National Laboratory to dive into those nuances for renewable generation technologies. Without the ATB, analysts would have to seek out data in many places and are likely to have inconsistent assumptions.
How does NREL build the data each year?
We compile data from literature and expert surveys, studies, and industry partnerships.
Who are the primary ATB users?
The ATB is for any analyst out there who is trying to model the electric grid, or individual technologies, in the United States or internationally. We get questions from analysts all over the country and the world who want to use this data.
What cost and performance metrics are offered for solar technologies in the ATB?
We report upfront costs, operating costs, system performance, and financing costs for most technologies over a 30-year period. These values are used to calculate a levelized cost of energy (LCOE). Note that, while LCOE is an important metric of comparison between electricity generation technologies, there are other factors, such as the value of the energy, which must also be considered.
Today’s representative CSP technology for the ATB is the molten salt power tower with two-tank thermal energy storage, which drives a Rankine steam cycle. This utilizes molten sodium and potassium nitrate as the heat transfer fluid and the storage media.
How is solar data in the ATB used at NREL?
The solar data goes into NREL’s Standard Scenarios—a suite of forward-looking scenarios of the U.S. power sector to 2050 that are updated annually to support and inform energy analysis—but also any analysis done with the Regional Energy Deployment System (ReEDS) model, as well as many other NREL models.
ReEDS is NREL’s capacity deployment model that is used in many high-impact studies across the laboratory, currently including the Storage Futures Study and upcoming Solar Futures Study.
In the past, solar ATB data has been used in the SunShot 2030, Geothermal Vision Study, and Wind Vision Study. Truly, any sort of big study that NREL does with ReEDS uses ATB as the foundational model input for PV, CSP, and all technologies.
In additional to NREL use, have you seen it used outside of the lab?
Absolutely. Recently, the California Energy Commission and Cal ISO [California System Operator] commissioned modelers to look at the future of their grid. They utilized the ATB for their model inputs to understand impacts of policy with high renewables deployment.
Internationally, organizations like the energy department in Chile have utilized the ATB costs in their scenarios and come to us asking about costs in the market as a validation.
Are there any new features or developments related to solar in the 2021 update?
This year we made the exciting linkage between the ATB and NREL’s System Advisor Model (SAM) so that the costs of the representative CSP plant at the starting point of the projections, or the baseline, are reflected in the SAM model. With this development, people can now dive deep into our assumptions for how we came up with that assessment, down to the number of heliostats. From there, users can change the assumption as they think it should be or customize for their systems like longer storage times or more efficient technologies.
For both PV and CSP, we’ve expanded our resource classes so we have larger representation of how these systems will perform throughout the United States. We also do a better job this year of representing the ongoing operating costs of PV systems, including five new cost categories. That’s a big improvement.
We also added cost and performance metrics for PV-plus-battery storage. Previously, we only had separate PV and battery storage costs, but there is an ever-growing number of PV systems that are coupled with battery storage in the United States. We’re excited to include costs for those systems this year.
What are some trends that you’ve seen over the years in the ATB in terms of cost and performance of solar technologies?
Generally, performance has increased, and cost has decreased, dramatically for PV and overall in CSP. The ATB has shown us there are several paths forward for continued price reduction. In the Standard Scenarios studies, you can see that when price decreases, renewable energy can become a significantly larger share of U.S. electricity generation. When that happens, there is also a lot of opportunity for greater deployment of storage technologies.
Moving forward, how will you continue to improve the ATB?
The DOE recently made a down-selection of what they believe to be the next generation of CSP technologies as part of their Gen3 program, so going forward we would like to see those captured in the ATB with the same fidelity of modeling as the current technologies.
We’d also like to continue to watch the market for PV-plus-battery storage and how those systems are designed and operated to accurately reflect them in the ATB.
Sign up to receive news and updates about the Annual Technology Baseline.
Appreciate CleanTechnica’s originality? Consider becoming a CleanTechnica Member, Supporter, Technician, or Ambassador — or a patron on Patreon.


Environment
The UK wants to unlock a ‘golden age of nuclear’ but faces key challenges in reviving historic lead


The Sizewell A and B nuclear power stations, operated by Electricite de France SA (EDF), in Sizewell, UK, on Friday, Jan. 26, 2024. Photographer: Chris Ratcliffe/Bloomberg via Getty Images
Bloomberg | Bloomberg | Getty Images
The U.K. was the birthplace of commercial nuclear energy, but now generates just a fraction of its power from it — big investments are underway to change that.
The country once had more nuclear power stations than the U.S., USSR and France — combined. It was a global producer until 1970 but hasn’t completed a new reactor since Sizewell B in 1995.
Today, the country takes the crown not for being a leader in atomic energy, but for being the most expensive place in the world to build nuclear projects.
Nuclear energy accounted for just 14% of the U.K.’s power supply in 2023, according to the most recent data from the International Energy Agency, trailing its European peers and well behind frontrunner France at 65%.
There is ambition to change that and have a quarter of the U.K.’s power come from nuclear by 2050. Nuclear is considered an attractive bet gas it’s a low-carbon, constant energy source that can act as a baseload to complement intermittent sources like renewables.
“There’s a very clear momentum that has been observed,” Doreen Abeysundra, founder of consultancy Fresco Cleantech, told CNBC. It’s in part due to geopolitical tensions, which pushed energy security and independence onto public agendas.
However, the U.K.’s Nuclear Regulatory Taskforce called for urgent reforms after identifying “systemic failures” in the country’s nuclear framework. It found that fragmented regulation, flawed legislation and weak incentives led the U.K. to fall behind as a nuclear powerhouse. The government committed to implementing the taskforce’s guidance and is expected to present a plan to do so within three months.
Going big – or small
The U.K. is spreading its bets across tried-and-tested large nuclear projects and smaller, next-generation reactors known as small module reactors (SMRs).
British company Rolls-Royce has been selected as the country’s preferred partner for SMRs, which are effectively containerized nuclear reactors designed to be manufactured in a factory. Many include passive cooling techniques, which supporters argue makes them safer and cheaper.
Nuclear has long come under fire by environmentalists due to radioactive waste and disasters like Chernobyl. Indeed, the U.K.’s first commercial plant Windscale became its worst nuclear accident in history when it melted down in 1957.
On October 10, 1957, Windscale became the site of the worst nuclear accident in British history, and the worst in the world until Three Mile Island 22 years later. A facility had been built there to produce plutonium, but when the US successfully designed a nuclear bomb that used tritium, the facility was used to produce it for the UK. However, this required running the reactor at a higher temperature than its design could sustain, and it eventually caught fire. Operators at first worried that e
Photo: George Freston | Hulton Archive | Getty Images
Most SMRs use light water reactor technology – think of the planned large-scale nuclear plant Sizewell C, just “shrunk down,” said Abeysundra – which is tried and tested.
Other designs, known as “advanced” reactors, are more experimental. For example, those that change the cooling solution or solvent, which is typically used in the process of separating and purifying nuclear materials.
The U.K.’s first SMR will be at Wylfa, in Wales, though no timeline has been given for its completion. The site will house three SMRs and grow over time.
In September, the country signed a deal with the U.S. to enable stronger commercial ties on nuclear power and streamline licensing for firms that want to build on the opposite side of the Atlantic.
However, “the first thing is, there is not, at the moment, a single SMR actively producing electricity under four revenues. They will all come at best in the 30s,” Ludovico Cappelli, portfolio manager of Listed Infrastructure at Van Lanschot Kempen, told CNBC.
While SMRs are a “game changer” thanks to their ability to power individual factories or small towns, their days of commercial operation are too far away, he said. From an investment standpoint, “that is still a bit scary,” he added.
To secure the large baseloads needed to offset the intermittency of renewables, “we’re still looking at big power stations,” added Paul Jackson, Invesco’s EMEA global market strategist.
Nuclear share of total electricity (2023)
IEA
SMRs “probably” do have a role — “they can clearly be more nimble” — but it will take time to roll them out, Jackson said, casting doubt on the U.K.’s ability to be a leader in nuclear, as France and China are already miles ahead.
The U.K. government body Great British Energy-Nuclear is set to identify sites for an additional large-scale plant, having already acquired one in Gloucestershire, in the west of England, as well as the site in Wales.
“We are reversing a legacy of no new nuclear power being delivered to unlock a golden age of nuclear, securing thousands of good, skilled jobs and billions in investment,” a spokesperson for the U.K. government’s Department for Energy Security and Net Zero told CNBC.
“Sizewell C will deliver clean electricity for the equivalent of six million of today’s households for at least six decades, and the UK’s first small modular reactors at Wylfa will power the equivalent of three million homes, bringing energy security,” they added.
Innovation in funding
The U.K. has a strong legacy to build on. It pioneered fresh funding mechanisms to make large-scale nuclear projects investible so that they are less reliant on direct government funding, such as a Contract for Differences, which was used for Hinkley Point C.
The mechanism guarantees a fixed price for the electricity generated over a long period of time in order to de-risk investments in an industry that’s known for running over time and budget. Hinkley Point C was initially expected to cost £18 billion (over $24 billion) but the bill has slowly crept up.
“That fixes one part of the equation, the price risk,” Cappelli said of nuclear investments, but the second risk is construction delays.
The Regulated Asset Base (RAB), first used for nuclear at Sizewell C, attempts to reconcile this. Investors get paid from the day they cut a check for a nuclear project, rather than the day it starts operating. Sizewell C is expected to cost £38 billion to build.
Private market investors are increasingly interested in next-generation nuclear as a way to offset soaring energy demands from AI, resulting in a host of young companies trying to build out facilities. Perhaps the most famous is Oklo, a U.S. firm that was taken public by a Special Purpose Acquisition Company (SPAC) founded by OpenAI’s Sam Altman.
Rendering of a proposed Oklo commercial advanced fission power plant in the U.S.
Courtesy: Oklo Inc.
The U.K.’s advanced modular reactor hopeful Newcleo, which uses lead for cooling, moved its headquarters from London to Paris in 2024 — a strategic move to deepen its European footprint. At the time, it told World Nuclear News that it still plans to have a commercial reactor up and running in the U.K. by 2033, but the firm has since scaled back its British efforts.
Meanwhile, Tokamak Energy and First Light Fusion call the U.K. home. They both focus on nuclear fusion, the process of generating power by combining atoms, though this technology is yet to get out of the lab. All of today’s nuclear power comes from fission, where atoms are spit. The U.K. announced £2.5 billion for a world-first fusion prototype in June.
The next generation of engineers
The U.K. faces challenges in access to relevant talent, which is crucial for scaling projects effectively. The country is heralded for its world-class universities and technical know-how, “but that is very much book knowledge,” said Van Lanschot Kempen’s Cappelli.
“What we need is real on-the-ground expertise, and that we are probably lacking for the simple reason that we haven’t been doing it for a very long time,” he said.
For Abeysundra, there’s one area where the U.K. stands out: its mindset. “There is so much knowledge, innovation, and that can-do attitude, which I don’t see as much in other nations,” she said, pointing to the U.K.’s trailblazing role in the Industrial Revolution and establishment of offshore wind energy.
The U.K. government positioned nuclear energy as a key element of the future clean energy workforce in its Clean Energy Jobs Plan released in October, while its national roadmap for nuclear skills, set out in 2024, focuses on apprenticeships, PhDs and upskilling mid-career workers. Industry-led initiatives such as the Energy Skills Passport also support the likes of oil and gas workers to gain green skills.
Securing the supply chain
Perhaps the toughest issue, however, is the supply chain.
Uranium, the fuel used to make a nuclear reaction, is dominated by just four countries, including Russia. Global demand for uranium could rise by nearly a third by 2030 and more than double by 2040, according to the World Nuclear Association, adding further reliance on a select few countries and pressure on developers.
The U.K. government has allocated funding to build up the supply chain and has committed to preventing the import of nuclear fuel from Russia by 2028. Fuel for Sizewell C will come from European or “Western suppliers,” Cappelli noted.
However, for him, it poses the question: How secure is nuclear energy really? “We have to build nuclear power plants, but we need to build the value chain,” Cappelli added.
Workers, expertise and funding are required for nuclear energy, but the supply chain is also key, he said. Otherwise, there will be “the same issues that we had with gas,” a nod to the U.K.’s reliance on just one supplier. Instead of gas, it will be with uranium.


Tesla has officially announced its 2025 Holiday Update, and this year, the automaker is not using the usually bigger update for any groundbreaking stuff, but there are a few interesting new smaller features.
You will find the release notes in this article.
It’s that time of year again. Every December, Tesla bundles a bunch of features it has been working on into a “Holiday Update” to give owners something to play with over the break.
While previous years have focused on adding major apps like Apple Podcasts or Steam integration, the holiday updates have become gradually weaker over the last few years, and they now concentrate mainly on playful features with smaller tweaks and add-ons.
Tesla announced the rollout in a post on X today:
Here is a breakdown of the main features in the 2025 Holiday Update. They are in order that Tesla announced them, which is generally from most to least important new feature.
Grok with Navigation Commands (Beta)

Many automakers are intergrating LLMs into their vehicles and unsuprisingly, Tesla went with Grok, which is developed by xAI, a company owned by Tesla CEO Elon Musk.
Tesla started the integration with an update last summer, but it only consisted of running the chat bot on Tesla’s in-car computer. It was the equivalent of using Grok on your phone as it couldn’t interact with the car.
Now, the automaker is starting to give Grok access to some vehicle functions, starting with navigation. Tesla announced:
Grok can now add & edit navigation destinations, becoming your personal guide.
Tesla says that to use Grok for navigation command, you have to set Grok’s personality to ‘Assistant’.
Tesla Photobooth

The second feature Tesla announced in the holiday update is the “photobooth”:
Turn your car into a photobooth! Take selfies from inside your Tesla & give yourself a makeover with fun filters, stickers, and emojis. Share with others right from the Tesla app
It sounds like a Temu Snapchat. To activate it: Go to Toybox > Photobooth
Dog Mode Live Activity

Now, to a more useful feature, Tesla has updated Dog Mode with a live activity feed:
When Dog Mode is active, you’ll see a Live Activity on your iPhone featuring periodic snapshots of your vehicle’s cabin along with live updates on temperature, battery & climate conditions
Dashcam Viewer Update
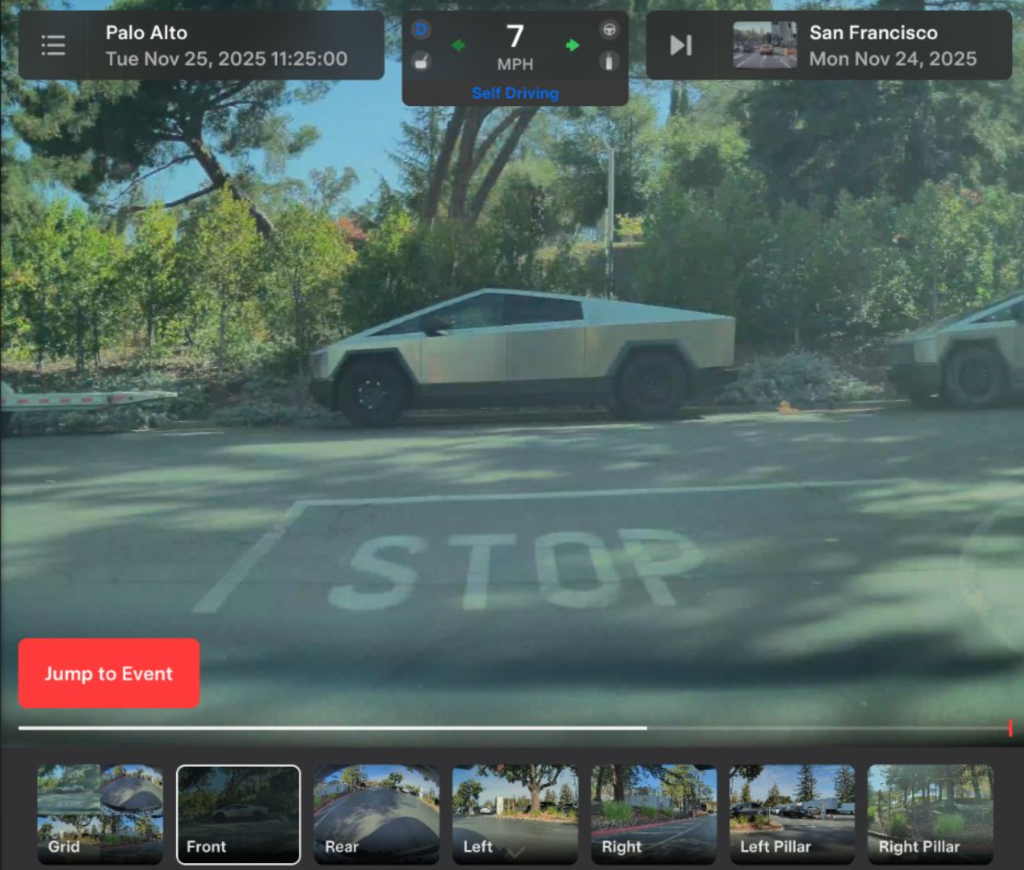
Tesla also added a bunch of information to the Dashcam viewer:
Dashcam clips now include additional details such as speed, steering wheel angle & self-driving state
Santa Mode

You can update the car visualization to this image. Tesla writes in the notes:
Santa Mode now adds festive snowmen, trees, a lock chime & snow effects for a 3D visual treat
You have select ‘Santa’ in the Toybox to activate it.
Light Show Update
Tesla has a dded a new light to the song “Jingle Rush”:
Play instantly or schedule it up to 10 minutes in advance, either on a single vehicle or synced with friends. You can also control interior lighting, add display color effects & create longer custom shows
Custom Wraps and License Plates
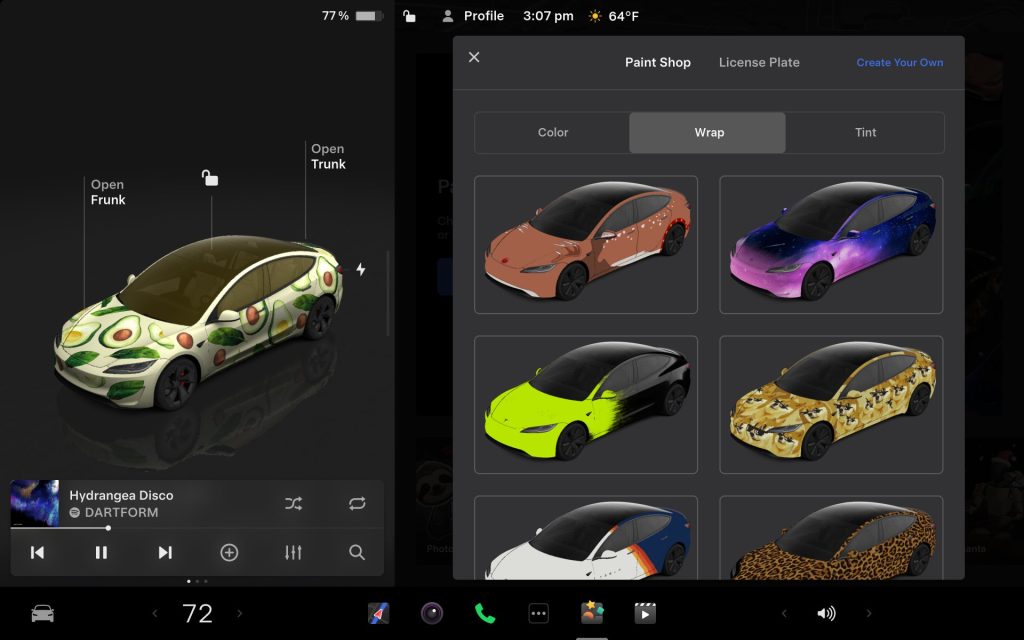
Back to slightly more useful features, Tesla has added custom wraps visualizations:
Personalize your Tesla avatar with window tints, custom wraps & license plates. Use one of many preloaded designs or create and upload your own using a USB flash drive to make your vehicle unique
You can select ‘Paint Shot’ in the Toybox to access it.
Navigation Improvements
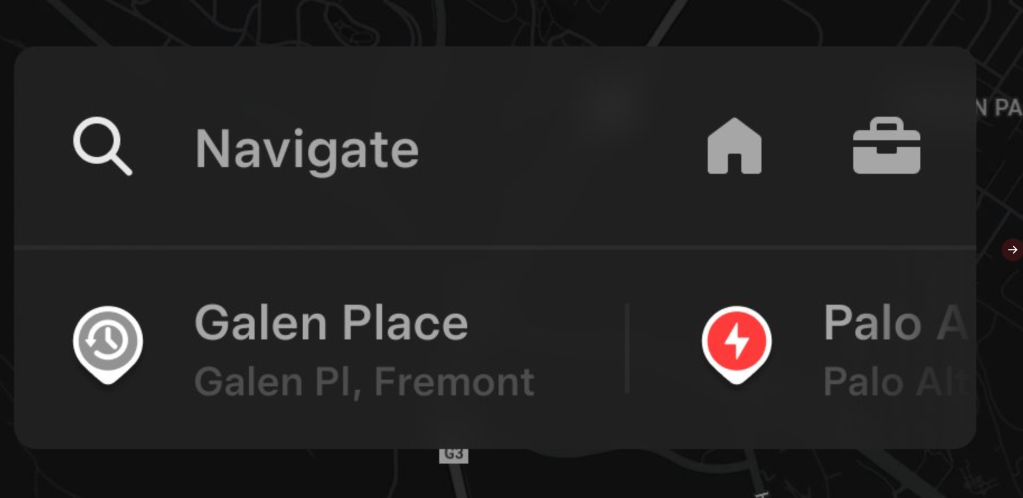
A slight change to the nav UI:
Reorder your navigation favorites & set Home or Work by dropping a pin anywhere on the map
You can also view suggested destinations based on your recent trips and habits while parked
Supercharger Site Map
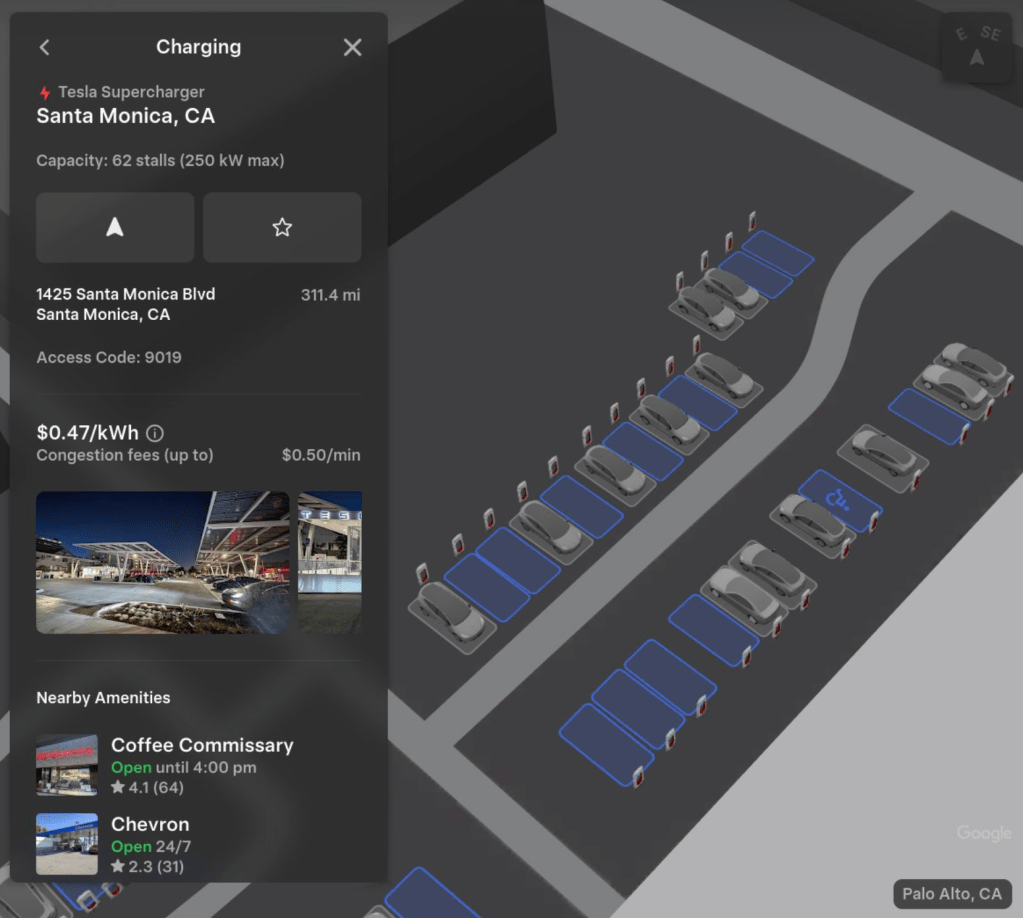
In line with the navigation update, you get a cool 3D view at some Supercharger stations straight in the navigation:
You can now see a 3D view of select Tesla Superchargers by tapping “View Site Map”. When navigating to a pilot location, the site layout and live occupancy (Available / Occupied / Down) will be displayed upon arrival
This could be useful to plan exactly where you’ll park and could open the door to a reservation system, which could be specifically useful for pull-in stalls.
Automatic HOV Lanes Routing
Navigation now includes an option to use high-occupancy vehicle (HOV) carpool lanes. Your route will automatically select the carpool lane when eligible, based on time, location, passenger count & road restrictions
Controls > Navigation > Use HOV Lanes
Phone Left Behind Chime
Your vehicle will chime a few seconds after the doors close if a phone key is inside the cabin or a phone is left on the wireless charger and no occupants are detected. Phone key detection requires UWB-supported devices.
Controls > Locks > Phone Left Behind Chime
Charge Limit per Location
You can now save a charge limit for your current location while parked & it will be applied automatically next time you charge there
Controls > Charging
SpaceX ISS Docking Simulator

Become an astronaut and prove your skills by docking with the International Space Station. Control & guide the rocket in this 3D docking simulator game using a set of controls based on actual interfaces used by NASA astronauts.
Arcade > SpaceX ISS Docking Simulator
Other improvements
- Enable or disable wireless phone charging pads in Controls > Charging (S3XY) or Controls > Outlets & Mods (Cybertruck)
- Add Spotify tracks to your queue right from the search screen & scroll through large Spotify playlists, albums, podcasts, audiobooks & your library seamlessly, without paging
- Take the vibes up another level with rainbow colors during Rave Cave. Accent lights color will change along with the beats of your music. App Launcher > Toybox > Light Sync
- Lock Sound now includes Light Cycle from Tron Mode. Toybox > Boombox > Lock Sound
Feature availability subject to vehicle hardware & region
Electrek’s Take
This is a bit of a mixed bag, which is typical for Tesla’s Holiday Updates.
On one hand, many useless features that will be probably be used once or twice and never again, like the photobooth.
But on the other hand, you have some decent new features, specifically to the navigation system, which put together make for a more than decent upgrade.
FTC: We use income earning auto affiliate links. More.


Kia is extending one of its biggest promotions yet, knocking over $10,000 off every EV in its lineup.
Kia knocks $10,000 off EV models
Who said electric vehicles would get more expensive after the $7,500 federal tax credit ended? Kia must not have gotten the memo.
Last month, Kia launched a new promotion, offering a $10,000 customer cash discount for all EVs, including the EV6, EV9, and Niro EV. The discount knocks nearly 25% off MSRP on Kia’s cheapest model, the Niro EV. On the entry-level EV6, it’s 23% off MSRP, while $10,000 off the EV9 is about an 18% discount.
The discounts ended on December 1, but Kia has extended them for at least another month. During its Season of New Tradition sales event, Kia is now offering even more savings.
The 2025 Kia EV6 and Niro EV are now eligible for up to $11,000 in customer cash, including a $10,000 cash back offer and a $1,000 retail bonus cash discount.

If you’re looking for something a little bigger, the 2026 EV9, Kia’s three-row electric SUV, is available with up to $10,500 in bonus cash.
If you choose to finance, Kia is offering 0% APR for up to 72 months, plus $3,500 APR Bonus Cash on the EV6 and Niro EV. The larger EV9 is available with 0% APR for up to 60 months with a $3,000 APR Bonus Cash offer.

The 2025 Kia Niro EV and EV6 are available to lease, starting at $209 and $309 per month for 24 months. The 2026 EV9 is listed with monthly leases starting at $419.
The new sales event comes after Hyundai extended its EV promotions, keeping the IONIQ 5 as one of the most affordable EV leases in the US, starting at just $189 per month.
Kia’s Seasons of New Traditions sales event runs until January 2, 2026. Some deals may vary by region. You can see offers near you by using the links at the bottom.
Interested in test-driving one for yourself? We can help see what’s available in your area. Check out our links below to find Kia and Hyundai EVs near you.
FTC: We use income earning auto affiliate links. More.
-
 Sports2 years ago
Story injured on diving stop, exits Red Sox game
-
 Sports3 years ago
‘Storybook stuff’: Inside the night Bryce Harper sent the Phillies to the World Series
-
 Sports2 years ago
Game 1 of WS least-watched in recorded history
-
 Sports3 years ago
Button battles heat exhaustion in NASCAR debut
-
 Sports3 years ago
MLB Rank 2023: Ranking baseball’s top 100 players
-
Sports4 years ago
Team Europe easily wins 4th straight Laver Cup
-
 Environment3 years ago
Japan and South Korea have a lot at stake in a free and open South China Sea
-
 Environment1 year ago
Here are the best electric bikes you can buy at every price level in October 2024