
U.S. Offshore Wind Industry Has Electrifying Future
Offshore wind holds great promise as a source of clean, domestic, renewable energy that can meet the needs of communities along the nation’s coastlines. And — according to the Offshore Wind Market Report: 2021 Edition, written by a team of researchers at the U.S. Department of Energy (DOE) and its National Renewable Energy Laboratory (NREL) — the U.S. offshore wind industry made gale-force gains in 2020 and early 2021. The offshore wind pipeline grew 24% in that time period, with 35,324 megawatts (MW) now in various stages of development.
And that is not all. Increased industry interest, combined with the Biden administration’s goal to deploy 30 gigawatts (GW) of offshore wind power by 2030, may propel the offshore wind energy industry to greater heights in the coming years.
Released on Aug. 30, 2021, the report highlighted that:
- The U.S. offshore wind pipeline includes two operating projects: the 30-MW Block Island Wind Farm off Rhode Island and the 12-MW Coastal Virginia Offshore Wind pilot project. The 800-MW Vineyard Wind 1 project near Massachusetts became the first fully approved, commercial, offshore wind energy project in the United States, receiving all permits, an offtake contract to sell the power it generates, and an interconnection agreement to deliver that electricity to the grid.
- Fifteen projects in the offshore wind energy pipeline have reached the permitting phase, 16 commercial leases in federal waters have gained exclusive site control, and seven wind energy areas can now be leased at the discretion of the federal government. The Bureau of Ocean Energy Management (BOEM), which regulates energy development in federal waters, has also designated nine Call Areas — areas being considered for future offshore wind energy development.
- The Biden administration’s target of installing 30 gigawatts of offshore wind by 2030 is the United States’ first national offshore wind energy goal. Alongside this national-level goal, states are aiming to procure at least 39,298 MW of offshore wind capacity by 2040. The U.S. offshore wind energy industry made additional supply chain and infrastructure investments over the past year, like the first U.S.-flagged offshore wind turbine installation vessel, which began construction in Brownsville, Texas, in 2020.
- Technology trends indicate growing turbine sizes, which is one of the main drivers behind lower offshore wind energy costs. Three leading turbine manufacturers — Siemens Gamesa, Vestas, and General Electric — have announced the development of larger offshore wind turbines ranging from 12 to 15 MW. These manufacturers have reported their intention to make wind turbines at these nameplate ratings available for purchase by 2024 or sooner, and U.S. orders indicate that most projects in the current pipeline will obtain wind turbines from one of these manufacturers.
- Governments, energy companies, and end users are increasingly looking at offshore wind as a power source to produce green hydrogen, which can be used in other sectors of the economy — like transportation, heating, industry, grid storage — as a zero-emission fuel.
“This report shows that the offshore wind market is on an upward curve, both nationally and globally,” said Walt Musial, an NREL principal engineer and the lead report author. “Maturing technology and falling costs have driven that curve for several years, and today, we’re seeing a continuation of those trends. Here, in the United States, federal and state support are also adding momentum.”
NREL and DOE began working in offshore wind energy research in 2003 to address the growing interest in offshore wind power technology and innovation, both domestically and in Europe. Since then, NREL’s work in offshore wind energy has included:
- Developing concepts to accelerate technological advancement
- Working with DOE and BOEM (and previously the Minerals Management Service) to evaluate possible sites and technologies that can be deployed in the United States
- Working with industry members to create partnerships and relationships that could lead to commercial systems and projects
- Creating open-source engineering tools and standards for offshore wind turbine designs
- Developing economic models and analyses that demonstrate potential for cost reduction and lower uncertainty of offshore wind costs
- Conducting resource assessments that have validated offshore wind power as a potentially major contributor to the electric grid
- Providing analyses that inform understanding of future offshore wind technologies
- Designing technical training for BOEM and the Bureau of Safety and Environmental Enforcement staff
- Modeling national and regional grid systems to help electric utilities understand the impacts of offshore wind energy when integrated with the electrical grid.
“Looking to the future, we expect offshore wind energy in the United States to expand beyond the North and Mid-Atlantic into the Pacific, Great Lakes, and the Gulf of Mexico,” Musial said. “That expansion means abundant energy at lower costs, job growth, and progress toward decarbonization. NREL will continue to leverage its expertise, world-class facilities, and industry, research, and commercial partnerships to help the United States lead the charge forward.”
The Offshore Wind Market Report: 2021 Edition provides detailed information about the U.S. and global offshore wind energy industries to inform policymakers, researchers, and analysts about technology and market trends. The report covers the status of more than 200 globally operating offshore wind projects through Dec. 31, 2020, and provides details and analysis on a broader global pipeline of projects in various stages of development. To deliver the most up-to-date discussion about this evolving industry, the report also provides a deeper assessment of domestic offshore wind energy developments and events through May 31, 2021.
The report is a companion to the Land-Based Wind Market Report: 2021 Edition, prepared by DOE’s Lawrence Berkeley National Laboratory, and the Distributed Wind Market Report: 2021 Edition, prepared by DOE’s Pacific Northwest National Laboratory. These three reports offer unbiased, independent, public reporting of the current state of the wind energy industry and provide insight into multiyear trends.
DOWNLOAD THE REPORT:
Offshore Wind Market Report: 2021 Edition: Full Report
Offshore Wind Market Report: 2021 Edition: Executive Summary
Offshore Wind Market Report: 2021 Edition: Summary Slides
Offshore Wind Market Report: 2021 Edition Data
Article courtesy of NREL.
Appreciate CleanTechnica’s originality? Consider becoming a CleanTechnica Member, Supporter, Technician, or Ambassador — or a patron on Patreon.


This week, BYD crossed a major manufacturing milestone as its battery production crossed 113 GWh in the first three quarters of 2025 – but instead of celebrating, the company is doubling down with a new “Zero Defects” initiative to bring battery quality to an even higher level.
CarNewsChina reports that the new “Zero Defects” plan at BYD was launched internally at the start of Q3, with a focus on minimizing manufacturing defects across all stages of the battery’s life, from the manufacturing line to the end user.
The initiative coincides with BYD’s growing role as a battery supplier to other automakers and its expanding battery energy storage system (BESS) business, which are giving BYD both an international footprint and global benchmarks.
In its ongoing bid to prove itself even further in the global battery market, BYD will reportedly emphasize operational efficiency, error reduction, and standardization across manufacturing, process control, and customer service, with the end goal believed to be, “management practices comparable to those of Toyota.”
BYD on a charge

The Chinese automaker seems to be going from strength to strength in 2025, having overtaken EV sales leader Tesla in China back in June and repeating the trick again by overtaking Tesla sales in Europe in August.
Combine those EV sales with the fact that its domestic traction battery production reached 113.42 GWh in just the first three quarters of the year (with 23.65 GWh, or ~20%, being supplied to outside customers – including Tesla), and you might agree that betting against BYD seems to be a bad idea.
Note that BYD has not released official details regarding performance metrics or milestones for its new Zero Defects goal, but the message is clear: BYD plans to keep getting better.
SOURCE: CarNewsChina; images via BYD.

If you’re considering going solar, it’s always a good idea to get quotes from a few installers. To make sure you find a trusted, reliable solar installer near you that offers competitive pricing, check out EnergySage, a free service that makes it easy for you to go solar. It has hundreds of pre-vetted solar installers competing for your business, ensuring you get high-quality solutions and save 20-30% compared to going it alone. Plus, it’s free to use, and you won’t get sales calls until you select an installer and share your phone number with them.
Your personalized solar quotes are easy to compare online and you’ll get access to unbiased Energy Advisors to help you every step of the way. Get started here.
FTC: We use income earning auto affiliate links. More.


.jpg)
This week, the US Environmental Protection Agency proposed a plan to make cars less efficient when Americans are already paying record-high energy bills during an affordability crisis fueled by tariff-driven inflation. That plan is now up for public comment.
Since the beginning of this year, the occupants of the White House have been on a mission to raise costs for Americans.
This mission has encompassed many different moves, most notably through unwise tariffs.
But another effort has focused on changing policy in a way that will raise fuel costs for Americans, adding to already-high energy prices.
This specific rollback focuses on a rule passed under President Biden which would save Americans $23 billion in fuel costs by requiring higher fuel economy from auto manufacturers. By making cars use less fuel on average, Americans would not only save money on fuel, but reduce fuel demand which means that prices would go down overall.
The effort to roll back this rule was initially announced on the first day that Sean Duffy started squatting in the head office of the Department of Transportation. Duffy notably earned his transportation expertise by being a contestant on Road Rules: All Stars, a reality TV travel game show.
Then in June, Duffy formally reinterpreted the Corporate Average Fuel Economy (CAFE) standard, claiming falsely that his department does not have authority to regulate fuel economy.
Republicans in Congress even got into effort to raise your fuel costs, as part of their ~$4 trillion giveaway to wealthy elites included a measure to make CAFE rules irrelevant by setting penalties for violating them to $0. In addition, it eliminated a number of other energy efficiency and domestic advanced manufacturing incentives.
Duffy’s department then told automakers that they would not face any fines retroactively to 2022, which saved the automakers (mostly Stellantis) a few hundred million dollars and cost American consumers billions in fuel costs.
Then, finally, earlier this week, Duffy formally announced the proposed changes to the CAFE rules, lowering the required fuel economy for 2022-2031 model year vehicles, even despite all of the other changes in trying to make the rules unenforceable.
The theory behind this would be to make it harder to later enforce the rules, and to allow automakers to get off with more pollution, and to increase fuel demand and fuel prices for longer until a real government returns to power and starts doing its job to regulate pollution.
Specifically, the announcement changes the planned 2031 50.5 mpg target to 34.5 mpg, cutting vehicle efficiency by nearly a third, which will lead to a commensurate increase in your fuel costs (note: CAFE numbers are calculated differently, and tend to look higher than actual mpg numbers).
The regulation even explicitly describes ballooning vehicle sizes in a positive light, which is ironic given that at the same event, Mr. Donald Trump, the convicted felon who directed this change to begin with, also quipped that he wants to bring tiny Japanese kei cars to the US, displaying his lack of knowledge of why he was even in the room to begin with.
If President Biden’s regulations were retained through 2031, average fuel economy would have tripled since the 1970s, when CAFE targets were first put in place. In the last two decades, CAFE targets helped drive a 30% improvement in average fuel economy, saving an average of $7,000 over the lifetime of an average vehicle – and they did this without increasing vehicle prices.
Despite that the dictatorial regime proposing such braindead rule changes would rather just push its oil company funders’ demands through without having to consult the people it will harm, these rulemaking procedures are still governed by the Administrative Procedures Act. This law requires the government to accept public comments and to take into account and respond to substantive comments posted to the docket related to the rulemaking procedure.
And so, you can now leave your own comments on whether or not you think this plan to make cars larger, more dangerous and less efficient, thus raising your fuel costs, is a good one or not.
Comments can be submitted through this link. Information for the docket can be found at docket number NHTSA-2025-0491. The comment period ends on Jan 20 at 2026 at 11:59 PM EST (yes, that superfluous “at” is from the NHTSA’s docket, wonderful attention to detail from the fake lawyers running the place).
Another of the administration’s recent plans to raise your fuel costs, the EPA’s plan to increase gas prices by $.76/gallon by deleting climate science, was recently posted and received 568,326 comments, the vast majority of which opposed the plan. Public comment on that plan is closed now and the EPA is sifting through the mountain of comments made, trying to figure out a way to kill people and raise energy costs in service of their oil masters despite massive public opposition in a country that is supposed to be a democracy.
That plan also received a virtual public hearing where commenters could call in with their thoughts, held over a few days, during which a vast majority opposed the plan. We’re not aware of a similar hearing for this plan yet, but we’ll let you know if we hear about one.
And despite many readers’ probable initial reaction that the unqualified dictator pushing these plans won’t be interested in hearing your comments, it should be noted that improper rulemaking has and will continue to result in certain rules being thrown out in court. There is a legally required method to how the government makes rules, and courts can throw out regulations that do not follow the proper method. Part of that method includes seeking public feedback, and this is your chance to enter your thoughts into the official government record on this regulation specifically.
Public comments on this ridiculous plan are open through Jan 20, 2026 at 11:59 PM EST, 8:59PM PDT. Comments can be submitted here. In case you get lost, the docket code is NHTSA-2025-0491. DOT/NHTSA has to respond to legitimate concerns made during public comment periods or else the rule could be voided (as was the case for 90% of the cases the NRDC challenged last go around), so the more substantive your comment, the better.
The 30% federal solar tax credit is ending this year. If you’ve ever considered going solar, now’s the time to act. To make sure you find a trusted, reliable solar installer near you that offers competitive pricing, check out EnergySage, a free service that makes it easy for you to go solar. It has hundreds of pre-vetted solar installers competing for your business, ensuring you get high-quality solutions and save 20-30% compared to going it alone. Plus, it’s free to use, and you won’t get sales calls until you select an installer and share your phone number with them.
Your personalized solar quotes are easy to compare online and you’ll get access to unbiased Energy Advisors to help you every step of the way. Get started here.
FTC: We use income earning auto affiliate links. More.

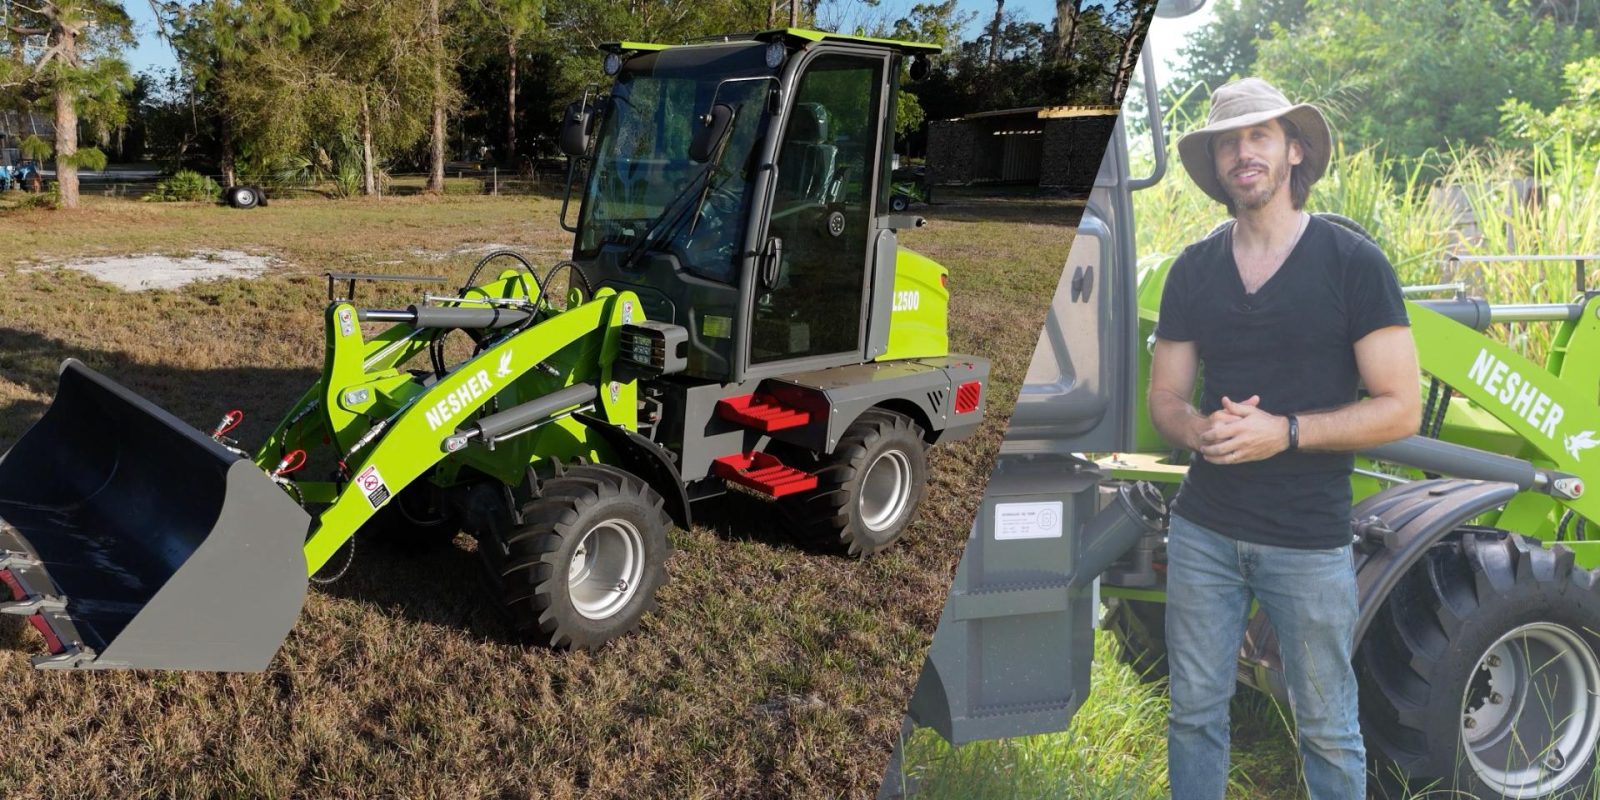
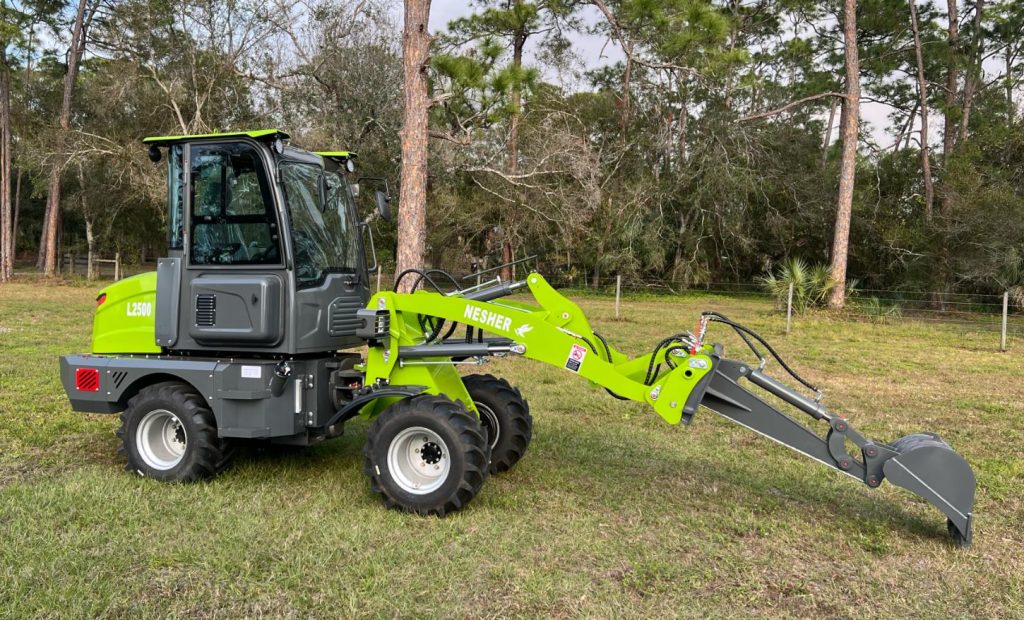
When a 40-foot container rolled up to my property and the doors swung open, I finally got to meet a machine I’d only last seen half-finished on a factory floor in China. Sitting up front, nose practically pressed against the container doors, was my new 10,000-plus-pound (4,700 kg) electric tractor: the NESHER L3000 wheel loader.
Technically, it’s part of a class known as articulating front loaders, a subset of the broader tractor family, and not a farm tractor like you may have seen before (though I’m working on a farm tractor!).
But if you need to lift, pull, drag, grapple, dump, drill, or dig things around your property, this is what these types of machines were made for.
And as wild as it was to see that giant electric machine roll down the ramps, it turns out that wasn’t the only “new toy” I got.
Soon after the arrival of the big guy, I had a second surprise to unload: a slightly smaller, much more approachable NESHER L2500, tipping the scales at a more manageable 6,400 lb (2,900 kg).
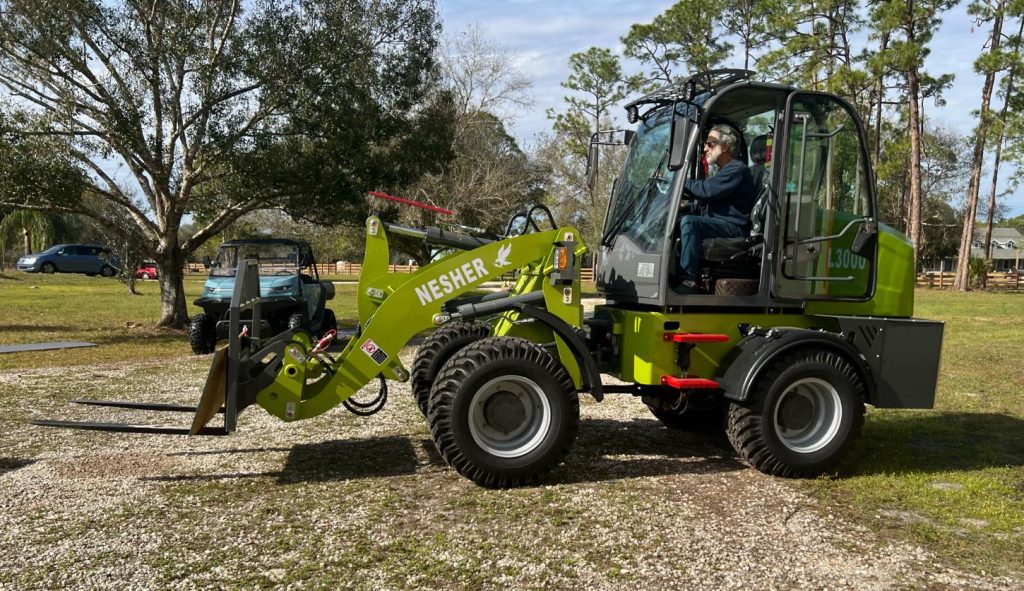
Meet the 5-ton lb NESHER L3000
Unloading these things and getting to know them well has been an incredibly fun process, and one that I love getting the chance to share in videos and articles like this one.
The L3000 is the biggest machine I’ve ever brought into the NESHER lineup, and it’s very much a “because we can” kind of loader. It’s rated for a 3,000 lb (1,360 kg) lift capacity (and it’s underrated), but that stat doesn’t really hit home until you see what that looks like in real life.
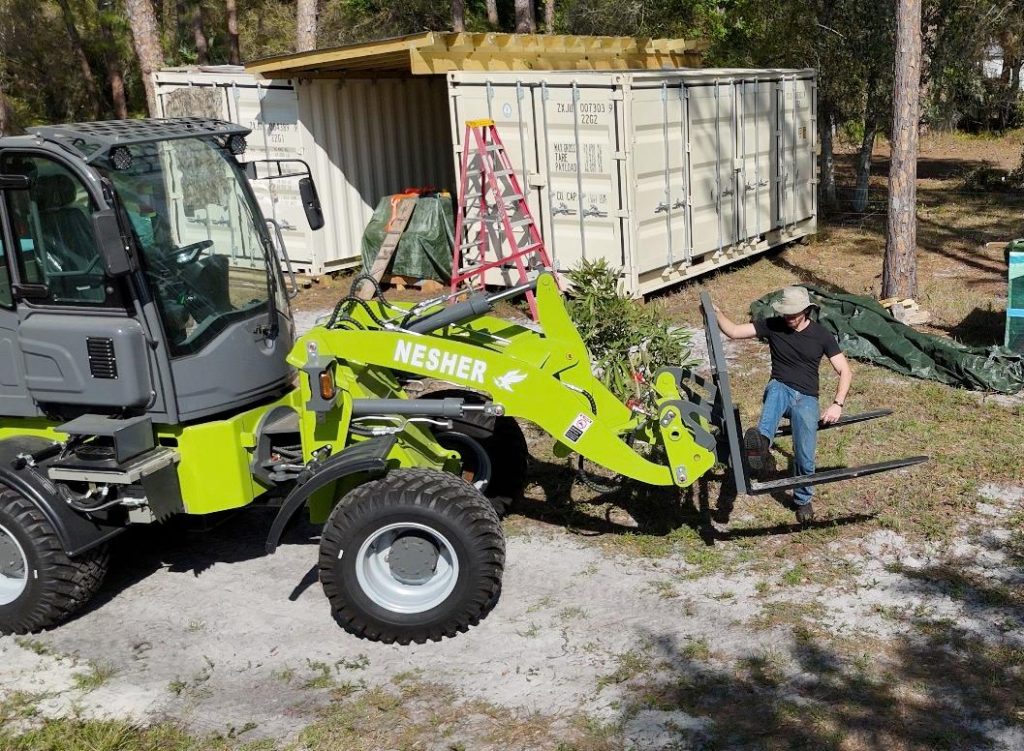
Right away I put it to work moving all sorts of heavy equipment around the property, from lifting a wooden shipping crate with an entire mini-excavator inside, to carrying around a full-size golf cart in a steel shipping crate as if it was a grocery bag, to even pushing shipping containers around the property and into position (I’ve been welding on roof structures between them to create some nice covered parking).
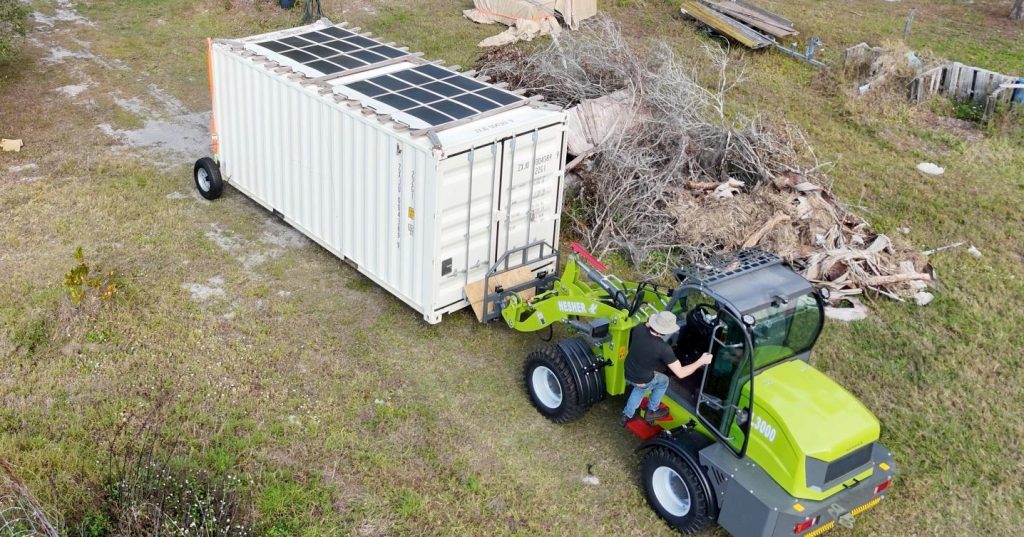
That last one is the moment you really feel the mass working in your favor. A 10,000 lb electric machine has the kind of traction and grunt where you barely notice the load. A tiny press on the accelerator and heavy objects just start moving.
I used a set of EZYwheels on one end of a shipping container and simply lifted the other end using the L3000’s pallet forks, allowing me to push and pull a roughly 5,000 lb (2,250 kg) solar shipping container that I built last year around a grassy pasture as if I were playing with toy cars in a sandbox.
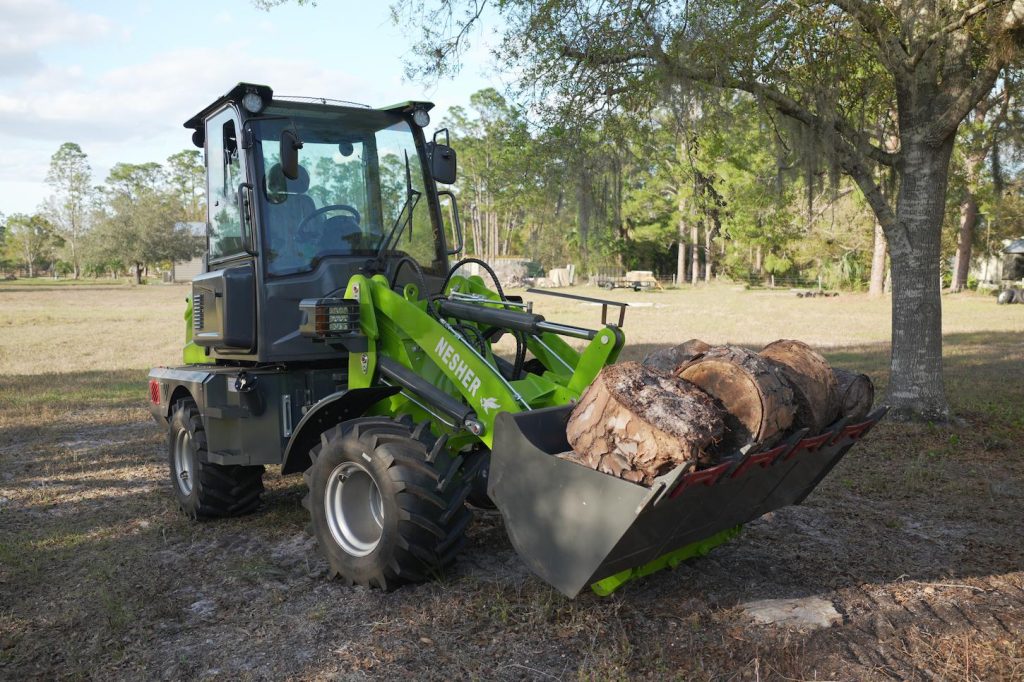
We even used it to right a tree that had blown over in the last hurricane, but was still alive and lying on its side. Without the slightest protest, the L3000 pulled it vertically and let us get some bracing under it so the root structure could regrow and anchor it back the way nature intended.
Under the floorboards is a 40 kWh AGM battery pack, good for around 6 hours of typical use on a charge. This isn’t meant for 12-hour highway construction shifts… it’s designed for landowners, homesteaders, small businesses, and anyone with a list of jobs that can be knocked out in a few focused hours.
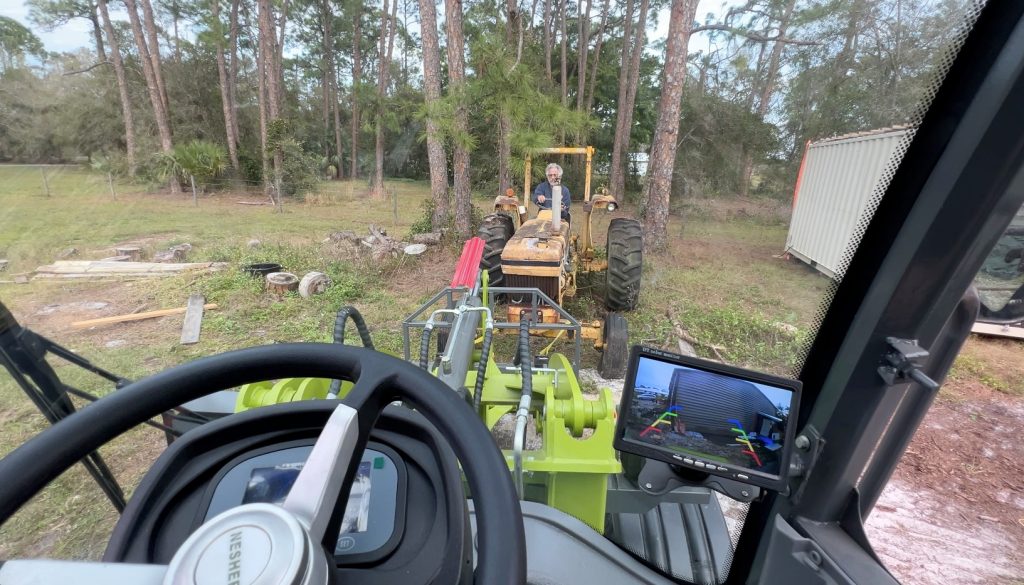
Charging is fairly straightforward and designed to be done anywhere: it uses standard North American 120VAC outlets, with twin onboard chargers to feed that big pack from a pair of household circuits overnight. The onboard chargers can accept 240V, but the 120V option allows for Level 1 charging anywhere a typical electrical outlet can be found.
I get a lot of questions about batteries, and one reason I liked the AGMs over lithium iron phosphate batteries is the ease of future work. While not rivaling LFP charge cycles, these should last for many years (my oldest NESHER tractors are around 2.5 years old and showing very minimal battery degradation), but when the batteries do eventually need to be replaced, AGM modules can be found much more easily and from local suppliers, even big box stores like Tractor Supply or Home Depot. They can also be removed one pack at a time by a single (strong) individual. Other advantages include better cold-weather performance without needing battery heaters, extra weight that serves as ballast and increases the lifting capacity of the machine, and lower total vehicle cost. Of course there are different unique advantages to LFP batteries, and like everything in life, there are tradeoffs, but this seems to be a good balance so far in our experience.
But wait… there’s a “smaller” one too
As fun as a 10,000 lb loader is, it’s honestly more machine than a lot of people want to maneuver around their property. That’s where my second new arrival comes in.
This smaller beast, my NESHER L2500, is rated for a 2,500 lb (1,140 kg) lift but weighs in at roughly 6,400 lb (2,900 kg). On paper, that sounds like a small step down from the L3000. In practice, it feels like a different category: more compact, more nimble, and more approachable for someone who doesn’t want their “yard tool” to weigh nearly as much as a school bus. It’s also even quieter than the L3000, as it uses a dedicated electric motor on each axle instead of a larger mid-mounted motor with dual drive shafts like the L3000.
Between the two, I actually prefer it. The machine has nearly as much capability, but is around 1/3 lighter and thus easier to maneuver and operate.
We’ve already used the L2500 for some creative jobs around the place. At one point, my dad and I basically turned it into a freight elevator, raising an old couch more than 10 feet up to a mezzanine of his shop. Another day, we used it to drag a massive tree trunk out of a pond after a hurricane turned that long-leaning tree into a floating navigation hazard. The loader treated that water-logged tree trunk like a toothpick.
The L2500 shares the same concept as the bigger machine: enclosed cab and heater, around 6 hours of use from a 25 kWh battery, easy residential charging, and enough lift and pull to make most homesteader and small farm tasks feel trivial. For a lot of people, this is the sweet spot. And in fact, I actually prefer it at this size. The L3000 is fun but more machine than most people need. The L2500 seems like the best balance of power, size, and value.
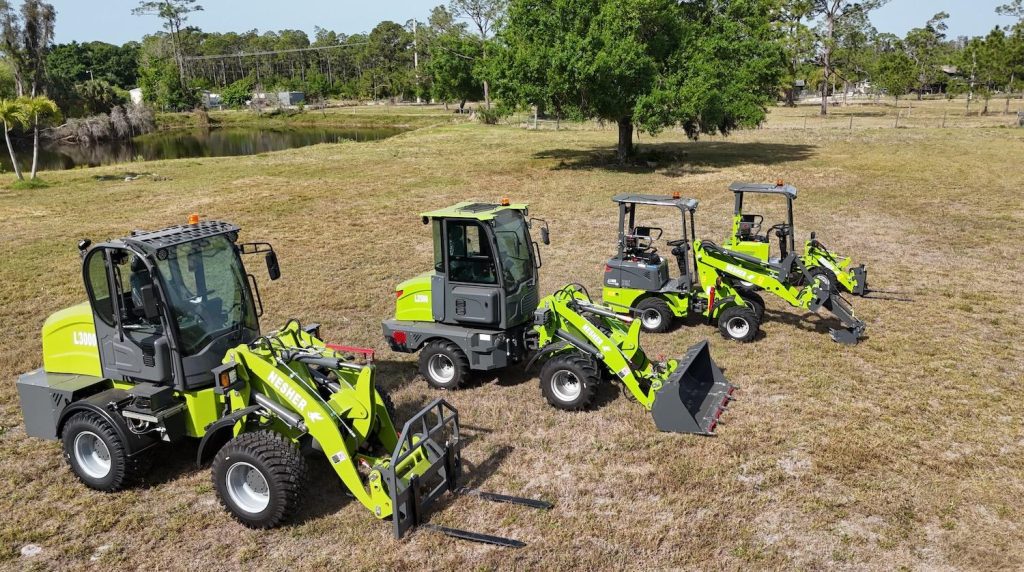
Attachments turn them into Swiss Army tractors
All of the loaders use quick-hitch front attachments, which is where things get fun. From the operator’s seat, you can drive up to a bucket, drop it, roll right into a pallet fork, and latch it without climbing down every time.
For attachments with their own hydraulics, like augers, grapples, and the excavator-style digging attachment, you do still have to hop out to connect hoses, but the tradeoff is big. With the excavator attachment on the larger loaders, you can dig down around 6 feet (nearly 2 meters). That’s a major upgrade compared to my smaller NESHER machines that give closer to about 3.5 feet (around 1 meter) of digging depth from their excavator attachments. That covers a surprising amount of real-world work: laying pipe, planting trees, digging drainage, and shaping land.
That’s the real magic with these: you don’t need separate dedicated machines for every task. One electric loader, a handful of attachments, and suddenly you’re lifting shipping containers, pulling trees upright, digging trenches, moving mountains of dirt or mulch, and doing oddball jobs you never expected to do with a conventional tractor.
Why go electric for heavy equipment?
Regular Electrek readers will already know the big advantages of going electric, and our own Jo Borràs has often covered some of the most interesting new additions to the world of electric heavy equipment from trucking to tractors to tools, but electrification is still a niche part of the industry.
And while I’ve talked a lot about what these machines can do, a question I still often get from curious neighbors and onlookers is, “Why electric?”
Part of it is maintenance. A diesel loader has a lot of ways to ruin your day: fuel system, injectors, emissions equipment, warm-ups, oil changes, filters, and so on. An electric drivetrain is basically a cordless drill scaled up: battery, motor, controller. The maintenance you do have – hydraulic oil, greasing the joints – is for the mechanical bits, not the engine. The powertrain, historically the worst part of owning any vehicle, just quietly works.
Then there’s sound. When you’re walking around an electric loader, you hear your own footsteps in the dirt as much as you hear the machine. You can talk to someone standing nearby without shouting over a clattering diesel engine. As the operator, you can talk to your crew or your family members in the yard without needing walkie-talkies. The reduced noise means you can even work around animals and livestock without spooking them. I can work right alongside the cows in my family’s pasture without bothering them. It’s just a calmer experience.
Health is another big one. If you spend hours a day sitting a few feet from a diesel tailpipe, that exhaust is going into your lungs. Diesel particulates are not something you want to marinate in for years. Electric loaders eliminate that constant stream of fumes.
And of course, there’s the environmental angle too. If you’re working the land because you love it and want to live with it, not just from it, then it feels a little odd to be coating it in exhaust and oil. Electric loaders don’t drip fuel, don’t belch smoke, and don’t add to greenhouse emissions the same way, especially if you’re charging from clean energy.
Final thoughts
I’ve talked at length about this process before, but for those who may be new around here, allow me to provide full disclosure: these are my machines. I helped design them, I walk the factory floor where I build them in China, I import them, I maintain the local spare parts warehouse, I wrote the operator’s manual, and I spend a ridiculous amount of time thinking about how to make electric machinery like this more accessible to average folks who want to manage their land instead of just for large contractors and businesses who can afford the six-figure machines from the big guys.
I’m proud of the work that has gone into getting them to this point, and of the fact that they are starting to become available in more countries (the first NESHER dealer in Canada just opened recently and a few other countries are in the works).
As a society, even a well-intentioned one looking for electric alternatives to replace our polluting legacy machines, we often spend so much time focusing on flashier vehicles, such as electric cars, trucks, and even bikes and scooters, that it’s easy to forget how much diesel is idling away on farms, work sites, and homesteads. Machines like these show that electric isn’t just possible in this space, but that it can actually be better, quieter, cleaner, and easier to live with.
Sure, that big NESHER L3000 loader isn’t for everyone. Most people would probably be better served by the L2500 or even the smaller L1400 or L880. And if you’re running round-the-clock road crews, you’ll still have a diesel fleet for a while, as there aren’t many electric machines that can do 16 or 20-hour shifts yet.
But for the growing number of landowners, small contractors, and homesteaders who want serious capability without the headaches and fumes of diesel, electric loaders are finally becoming a real option.
FTC: We use income earning auto affiliate links. More.
-
 Sports2 years ago
Story injured on diving stop, exits Red Sox game
-
 Sports3 years ago
‘Storybook stuff’: Inside the night Bryce Harper sent the Phillies to the World Series
-
 Sports2 years ago
Game 1 of WS least-watched in recorded history
-
 Sports3 years ago
Button battles heat exhaustion in NASCAR debut
-
 Sports3 years ago
MLB Rank 2023: Ranking baseball’s top 100 players
-
Sports4 years ago
Team Europe easily wins 4th straight Laver Cup
-
 Environment3 years ago
Japan and South Korea have a lot at stake in a free and open South China Sea
-
 Environment1 year ago
Here are the best electric bikes you can buy at every price level in October 2024