
Why Aren’t We Talking More About Life-Cycle Assessments For Energy Sources?
Life-cycle assessments are ways to gauge the impact of any product or process. What is the cost of a system over a defined period of time? Life-cycle assessments are really important as we consider the transition to renewable energy sources, especially as we share insights into a zero emissions future with newbies or cynics.
Life-cycle assessments provide an exhaustive overview of the upstream (material sourcing and delivery) and downstream (product distribution, use, and disposal) impacts associated with any given system. Originally designed to focus on environmental impacts by scientists, they now have been extended to examine social and economic impacts, sometimes called life-cycle costing, by policymakers and decision-makers. The most comprehensive evaluations begin with the extraction of raw material; move to the various steps of production, implementation, and operation; and extend all the way to the energy use of carriers to perform work.
Life-cycle analysis considers both upfront cost of production and incremental costs of operation and depreciation. As a data-intensive methodology, it incorporates all inputs and outputs, requires detailed information, and is organized into databases known as life-cycle inventories.
What Do the Scientists Say about Energy Resources & their Life-Cycle Assessments?
 Executive summaries from a variety of scientific white papers can offer us life cycle insights into different energy sources. Here are a few to peruse.
Active Transportation: Life-cycle analysis provides a comprehensive view of the environmental impact of transportation infrastructure due to processes involving construction, operation, and maintenance.
- Airplanes show the highest GHG emissions — 3 times that of cars and 6 times that of buses.
- Cars or buses show higher GHG emissions when considering life-cycle impacts than the results without the life-cycle impacts because the GHG impact of manufacturing and operating automobiles and buses could be greater than that of other modes.
- Walking does not require any tools, so its life-cycle impact is minimal compared to other modes.
- The GHG impact of producing and maintaining bicycles is much smaller than that of automobiles or public transportation vehicles.
- On balance, active transportation modes produce far less emissions than other modes even after taking into account all the life-cycle impacts.
Biomass: Co-firing biomass as a means of GHG abatement becomes economically competitive with traditional carbon capture and sequestration only after an incentive is in place to mitigate emissions.
- The point at which co-firing becomes an attractive option depends on the potential value of CO2, the level of an emissions penalty, and the type of plant.
- The break-even value would either represent the amount required on the sale of the captured CO2 in the capture cases, or a benefit received for the use of biomass as a fuel source in the non-capture cases, when compared to the economics of a supercritical (SC) PC plant without capture or co-firing.
- This value would need to be reached before incentivizing either CO2 capture or biomass co-firing. The emissions penalty would be the minimum value required to encourage the use of capture technology or abatement using biomass.
Hydropower: The assessment considers various ecological influence groups which could be generally categorized as — global warming, ozone formation, acidification, eutrophication, ecotoxicity, human toxicity, water consumption, stratospheric ozone depletion, ionizing radiation, and land use.
- Though water itself is not lethal, the electricity production process involves many stages, which creates environmental issues.
- Furthermore, the transportation medium of these elements to the plant location releases hazardous particles i.e., carbon monoxide, dust, and carcinogenic particles.
- Among the key impact groups, the whole outcomes show that a substantial ecological influence occurred at non-alpine region plants over alpine region plants. The reason behind this is that the long distance transportation of raw materials in non-alpine region hydropower plants due to unavailability at nearby locations where raw materials of the alpine based plants is available at nearby locations.
- The maximum impact is occurred at fine particulate matter formation impact category due to freshwater eutrophication category by both types of hydropower plants. The reason behind these impacts is the amount of toxic materials present as constituent of plant structure and its electricity production steps.
Natural Gas: This analysis takes into account a wide range of performance variability across different assumptions of climate impact timing.
- Natural gas-fired baseload power production has life cycle greenhouse gas (GHG) emissions 35% to 66 % lower than those for coal-fired baseload electricity.
- The lower emissions for natural gas are primarily due to the differences in average power plant efficiencies (46% efficiency for the natural gas power fleet versus 33% for the coal power fleet) and a higher carbon content per unit of energy for coal in comparison to natural gas.
- Natural gas-fired electricity has 57% lower GHG emissions than coal per delivered megawatt-hour (MWh) using current technology when compared with a 100-year global warming potential (GWP) using unconventional natural gas from tight gas, shale, and coal beds.
Petroleum: Petroleum is produced from crude oil, a complex mixture of hydrocarbons, various organic compounds, and associated impurities.
- The crude product exists as deposits in the earth’s crust, and the composition varies by geographic location and deposit formation contributors. Its physical consistency varies from a free flowing liquid to nearly solid. Crude oil is extracted from geological deposits by a number of different techniques.
- When comparing transportation GHG emissions, both the tailpipe or tank-to-wheel (TTW) emissions, and the upstream or well-to-tank (WTT) emissions are considered in the full well to wheel (WTW) life cycle.
- Extracting, transporting, and refining crude oil and bio-based alternatives on average account for approximately 20-30% of well-to-wheels (WTW) greenhouse gas (GHG) emissions with the majority of emissions generated during end use combustion in the vehicle phase (TTW).
- GHG emissions in the generic cases range from ≈105 to 120 g of CO2/MJ [gasoline basis, full fuel cycle, lower heating value (LHV) basis] when co-produced electricity displaces natural-gas-fired combined-cycle electricity.
- The carbon intensity varies with the energy demand of TEOR, the fuel combusted for steam generation, the amount of electric power co-generated, and the electricity mix. The emission range for co-generation-based TEOR systems is larger (≈70−120 g of CO2/MJ) when coal is displaced from the electricity grid (low) or coal is used for steam generation (high). The emission range for the California-specific cases is similar to that for the generic cases.
Solar: Life-cycle assessment is now a standardized tool to evaluate the environmental impact of photovoltaic technologies from the cradle to the grave.
- The carbon footprint emission from PV systems was found to be in the range of 14–73 g CO2-eq/kWh, which is 10 to 53 orders of magnitude lower than emission reported from the burning of oil (742 g CO2-eq/kWh from oil).
- Negative environmental impacts of PV systems could be substantially mitigated using optimized design, development of novel materials, minimize the use of hazardous materials, recycling whenever possible, and careful site selection. Such mitigation actions will reduce the emissions of GHG to the environment, decrease the accumulation of solid wastes, and preserve valuable water resources.
- Following a report published by the International Renewable Energy Agency (IRENA), the volume of PV panel waste could globally yield a value of up to 60–78 million tons by 2050. Recycling solar cell materials can also contribute up to a 42% reduction in GHG emissions.
Wind: Wind power presents minimal emissions and environmental impacts during the working phase, being considered as a “cleaner” generation source. But not all stages of wind power are so efficient.
- The extraction of raw materials, manufacturing, and transportation as part of wind power construction have significant emissions of CO2 and environmental impacts.
- Not only will improvements in logistics, transportation, a mixed electricity supplement, and a more efficient equipment production reduce CO2 emissions from wind power construction, new basic materials and innovative built techniques may decrease CO2 emissions and energy demand.
- Decommissioning stage may present a reduction of the energy consumption and CO2 emissions through reusing equipment, recycling critical materials in the end of life cycle, reducing the extraction of raw materials and the total consumption of resources.
- Such changes may create unexpected fluctuations in the market, such as shortages of supplies and dependence on exporters.
Of course, there are many other types of energy sources and other data analyses to consult to consider life cycle assessments. For more ideas, try Life Cycle Analysis of Energy for a good starting point.
Infographic retrieved from Department of Energy
Image retrieved from NASA
Appreciate CleanTechnica’s originality? Consider becoming a CleanTechnica Member, Supporter, Technician, or Ambassador — or a patron on Patreon.


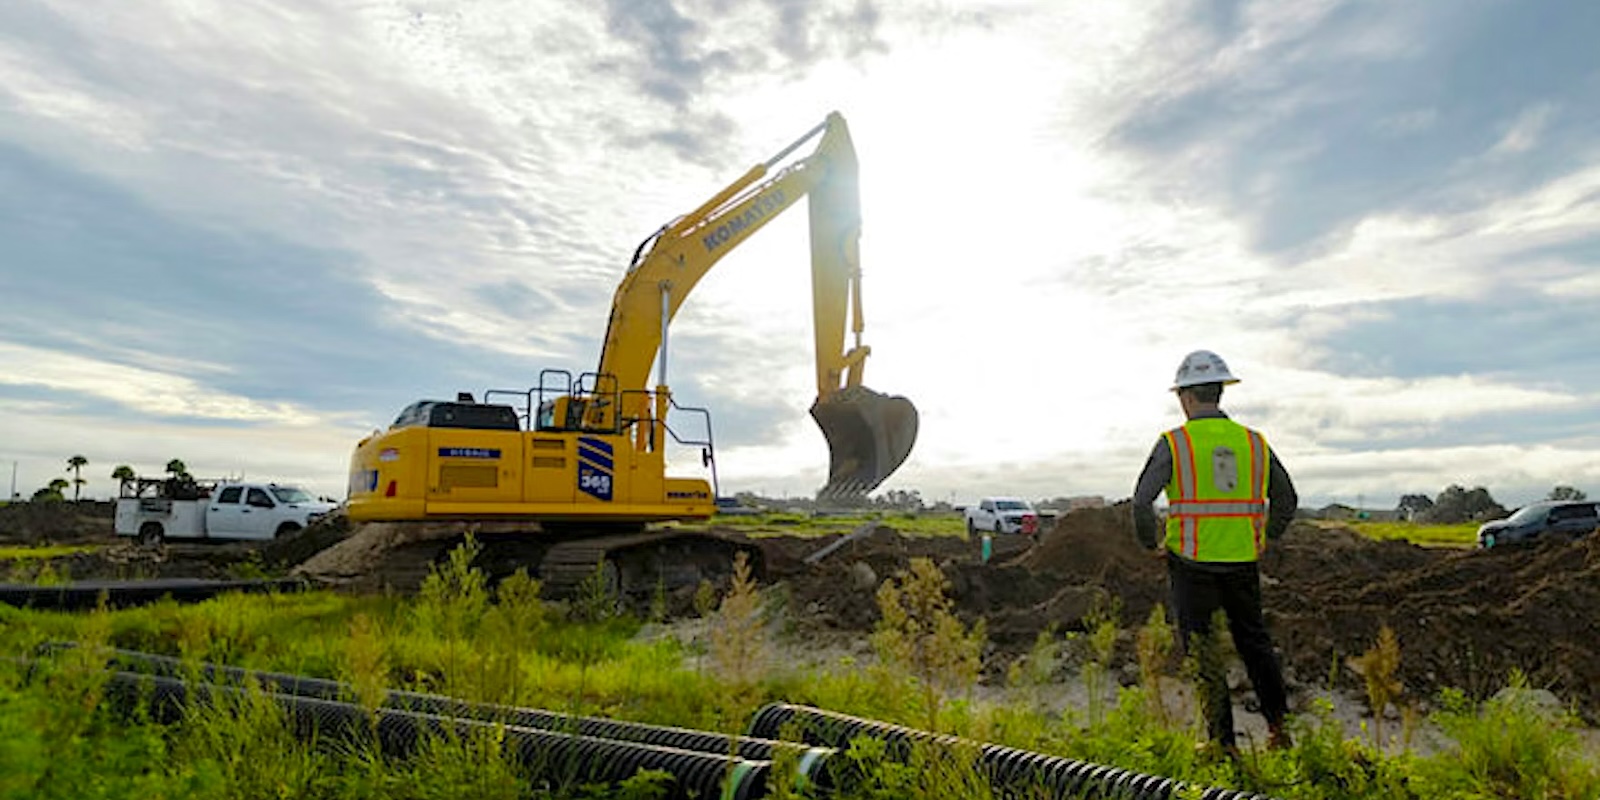
Thanks to a clever, fully electric swing system and “boom up” power assist features, the big PC365-11 hybrid excavator from Komatsu promises better performance and serious fuel savings compared to conventional diesel machines.
Komatsu says its PC365-11 hybrid excavator uses a “boom-up” power assist feature that captures and stores kinetic energy during different operation cycles, then taps into that power to provide an extra energy boost when needed. The result is 15% more productivity and a 20% improvement in fuel efficiency when compared to non-hybrid excavators in ~40 ton class.
“The PC365LC-11 was engineered for excellence in multifunction applications by leveraging its innovative electric powertrain system to boost job site productivity while reducing fuel consumption,” says Matthew Moen, Komatsu’s product manager. “To highlight these performance enhancements, we’re emphasizing the concept of ‘multifunction plus’ as the defining feature of this machine.”
How it works
Komatsu’s hybrid system replaces the conventional hydraulic swing function with a fully electric swing motor that draws power from an ultracapacitor (as opposed to a battery) energy storage unit. As excavator slows or stops swinging, something like a regenerative braking system captures the kinetic energy that would normally be lost as heat and stores it in the capacitor. Once there, the stored energy can be quickly released to power the swing motor or assist the engine, delivering up to an extra 70 hp when needed to support heavy lifting or digging cycles.
And, thanks to Komatsu’s proprietary software, all of this energy capture and reuse happens automagically during normal work, without the need for external charging. The fuel savings happen because removing the hydraulic load from the ICE engine allows it to run at an ultra-low idle, while the productivity comes from the greater power and overall speed of the electric operations vs. conventional hydraulics.
Electrek’s Take
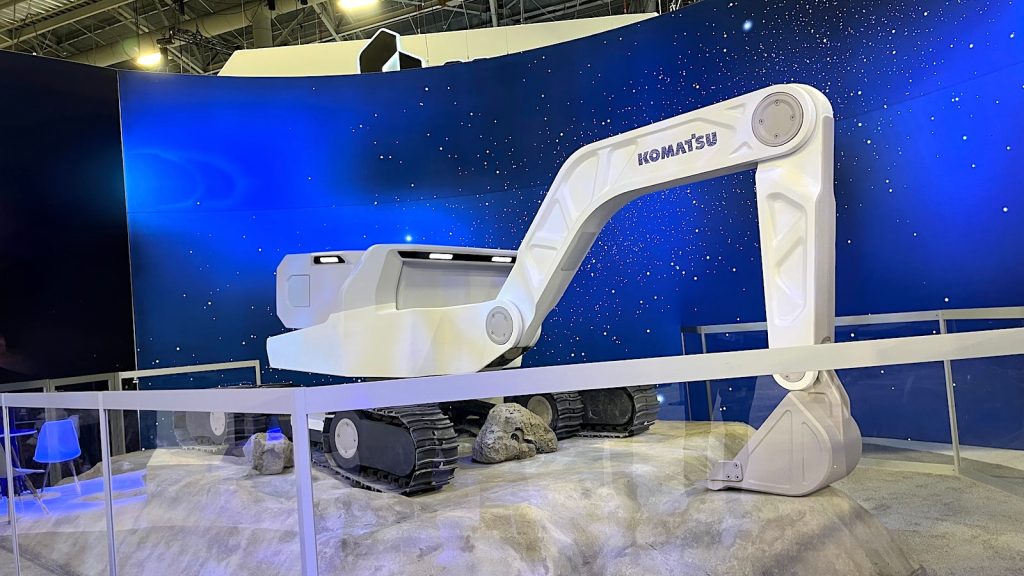
Trust me when I tell you that Komatsu didn’t wake up one day and decide to build a capacitor-based hybrid crane. One of their customers had the idea and came to them, promising orders. That’s what Komatsu does – from undersea remote control dozers to lunar mining rigs (above), if you bring Komatsu an order, they will absolutely find a way to fill it.
As for PC365-11 hybrid excavator, it’s packed with clever tech, overall – offering significant fuel, emissions, and TCO reductions without dramatically changing the operational logistics of an existing fleet’s operations. That’s all the sales pitch it needs.
SOURCE: Komatsu, via Equipment World.

If you’re considering going solar, it’s always a good idea to get quotes from a few installers. To make sure you find a trusted, reliable solar installer near you that offers competitive pricing, check out EnergySage, a free service that makes it easy for you to go solar. It has hundreds of pre-vetted solar installers competing for your business, ensuring you get high-quality solutions and save 20-30% compared to going it alone. Plus, it’s free to use, and you won’t get sales calls until you select an installer and share your phone number with them.
Your personalized solar quotes are easy to compare online and you’ll get access to unbiased Energy Advisors to help you every step of the way. Get started here.
FTC: We use income earning auto affiliate links. More.

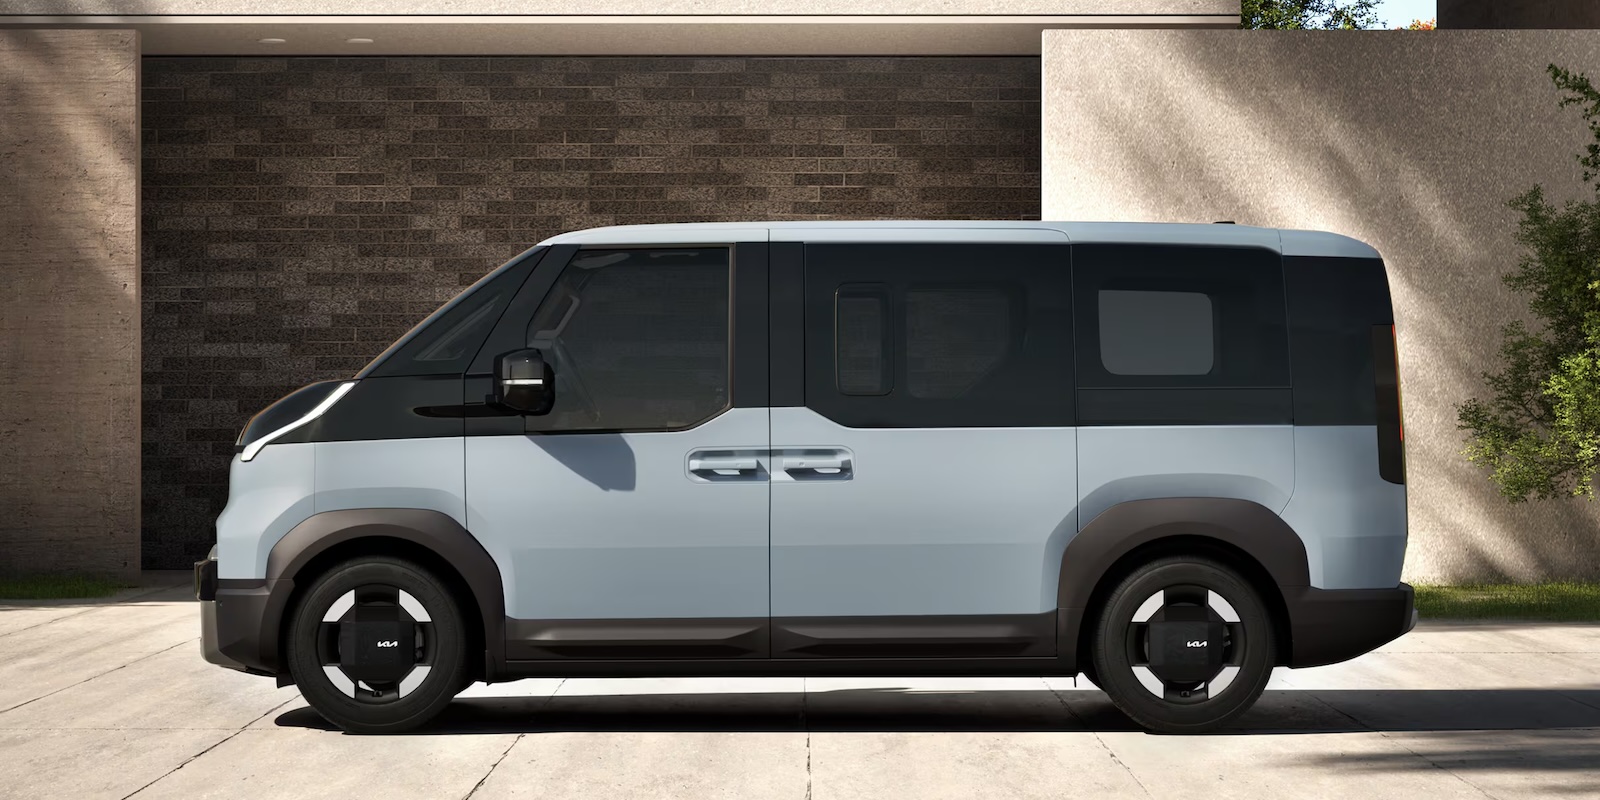
For serious fleet buyers, safety isn’t a “nice-to-have,” it’s an absolute must – and Kia’s new PV5 electric van meets that need with a positively stellar, five-star safety rating on the tough European NCAP safety test.
The new “do-it-all” Kia PV5 showed strong performance across a number of key safety categories, including Occupant Protection, Safety Assist/Crash Avoidance, and Post-Crash Safety. The PV5’s robust suite of standard ADAS technologies that includes AEB, Lane Support System, and Speed Assistance System also helped the new electric work van to deliver top marks in the NCAP’s “real world” test scenarios.
“The PV5 opens a new chapter in practical, electrified mobility, offering generous space and modular versatility for everyday use,” explains Sangdae Kim, Executive Vice President and Head of the (relatively) new PBV Business Division at Kia. “Achieving the top Euro NCAP five-star rating is clear validation of its safety performance and will serve as strong momentum as Kia expands its PBV lineup across Europe.”
The Euro NCAP tests highlighted the strong performance of a number of the PV5’s ADAS features, specifically calling out the following:
- Demonstrated strong responsiveness in vehicle-to-vehicle scenarios
- Provides additional protection for pedestrians behind the vehicle
- Avoided collisions in most pedestrian and cyclist test cases
The Kia PV5 slots into familiar territory for US buyers, landing roughly in the same size class as the Ford Transit Connect or Ram ProMaster City, with ~180 cubic feet of interior cargo space available, which is plenty to make it attractive for last-mile delivery and trade work in tight urban markets.
Globally, the PV5 is offered with a number of battery options, including a smaller 43.3 kWh Lithium-Iron-Phosphate (LFP) pack, as well as larger Nickel-Cobalt-Manganese (NCM) packs at 51.5 kWh and 71.2 kWh. The longest-range versions are good for about 250 miles of estimated range – more than enough for Kia to make a case for it as a practical, city-focused alternative to much larger (and pricier) electric vans.
Larger vans, by the way, that may not have that 5 star Euro NCAP rating.
Kia PV5
SOURCE | IMAGES: Kia; photo by Scooter Doll.
If you’re considering going solar, it’s always a good idea to get quotes from a few installers. To make sure you find a trusted, reliable solar installer near you that offers competitive pricing, check out EnergySage, a free service that makes it easy for you to go solar. It has hundreds of pre-vetted solar installers competing for your business, ensuring you get high-quality solutions and save 20-30% compared to going it alone. Plus, it’s free to use, and you won’t get sales calls until you select an installer and share your phone number with them.
Your personalized solar quotes are easy to compare online and you’ll get access to unbiased Energy Advisors to help you every step of the way. Get started here.
FTC: We use income earning auto affiliate links. More.
Environment
Waymo pauses robotaxi service in San Francisco after blackout chaos — Musk says Tesla car service unaffected

-
 Sports2 years ago
Story injured on diving stop, exits Red Sox game
-
 Sports3 years ago
‘Storybook stuff’: Inside the night Bryce Harper sent the Phillies to the World Series
-
 Sports2 years ago
Game 1 of WS least-watched in recorded history
-
 Sports3 years ago
Button battles heat exhaustion in NASCAR debut
-
 Sports3 years ago
MLB Rank 2023: Ranking baseball’s top 100 players
-
Sports4 years ago
Team Europe easily wins 4th straight Laver Cup
-
 Environment3 years ago
Japan and South Korea have a lot at stake in a free and open South China Sea
-
 Environment1 year ago
Here are the best electric bikes you can buy at every price level in October 2024