

Wind and solar are now beating coal in the US
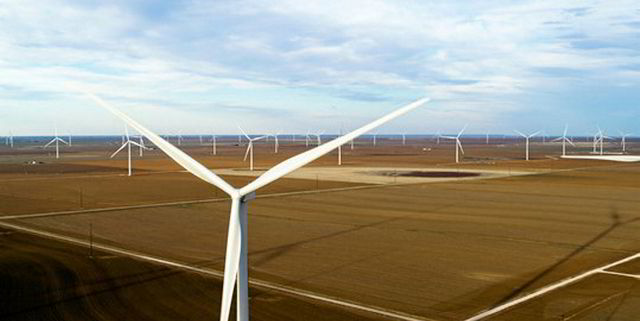
Wind and solar combined now provide more generating capacity and produce more electricity than coal in the US, according to new data from the EIA and the Federal Energy Regulatory Commission (FERC), which was reviewed by the nonprofit SUN DAY Campaign.
What the EIA reported
In the first two months of 2023, electrical generation by solar (including small-scale solar PV such as rooftop) grew by 6.7%, compared to the same two-month period in 2022 – faster than any other energy source, according to the latest issue of the US Energy Information Administration’s “Electric Power Monthly” report, which contains data through February 28. This was driven in large part by growth in “estimated” small-scale solar PV whose output increased by 23.6% and accounted for 32.5% of total solar production.
The mix of utility-scale and small-scale solar PV plus utility-scale solar thermal provided 3.9% of the US’s electrical output.
At the same time, electrical generation by wind increased by 6.6% compared to the same period a year ago and provided 12.2% of total electrical generation.
Together, wind and solar provided 16.1% of US electrical generation in the first two months of 2023; by comparison, electrical generation by coal dropped by 32.7% and provided 16.0% of total US electrical generation.
When generation by all renewable energy sources (i.e., including biomass, geothermal, and hydropower) is considered, renewables accounted for nearly a quarter (24.1%) of total generation and outproduced coal by 50.8%. Electrical production by the mix of renewables also surpassed that of nuclear power by 21.9%.
What FERC reported
Meanwhile, here’s what new data from FERC reflects, and it’s also for January and February 2023. FERc reports that wind energy’s share of total available installed utility-scale generating capacity has grown to 11.5%, while that of solar is now at 6.6%. Combined, wind and solar account for 18.1% of installed US generating capacity. On the other hand, coal’s share has continued its downward slide and is now just 17.1% of the total.
Moreover, the mix of all renewables now accounts for 27.6% of the US’s generating capacity and appears to be on track for rapid expansion over the next three years.
Between now and February 2026, FERC anticipates 17,690 megawatts (MW) of “high probability” net capacity additions by wind and 77,791 MW of “high probability” solar. FERC also reports that there may actually be as much as 66,322 MW of wind and 213,969 MW of solar in the three-year pipeline.
In contrast, it anticipates no new coal capacity additions, and total installed coal capacity may actually shrink by 28,507 MW. The net “high probability” capacities of both oil and natural gas are also seen as declining – by 1,572 MW and 574 MW, respectively – while that of nuclear power may fall by 123 MW.
SUN DAY Campaign’s executive director Ken Bossong said:
The trend lines are fairly obvious.
The gaps between the installed capacity of, and electrical generation by, renewable energy sources – led by wind and solar – and those of coal and nuclear power are not just growing, but accelerating rapidly.
Read more: Wind and solar achieve a record high of 12% of global electricity in 2022
Photo: Orsted
If you’re considering going solar, it’s always a good idea to get quotes from a few installers. To make sure you’re finding a trusted, reliable solar installer near you that offers competitive pricing, check out EnergySage. EnergySage is a free service that makes it easy for you to go solar. They have hundreds of pre-vetted solar installers competing for your business, ensuring you get high quality solutions and save 20 to 30% compared to going it alone. Plus, it’s free to use and you won’t get sales calls until you select an installer and you share your phone number with them.
Your personalized solar quotes are easy to compare online and you’ll get access to unbiased Energy Advisors to help you every step of the way. Get started here. – ad*
FTC: We use income earning auto affiliate links. More.
Environment
Ferrari is rejecting fake engine noise for its first EV, and opts for ‘authentic’ motor sound


Ferrari has released details about its approach to powertrain sounds with its first electric vehicle, the Elettrica, and I am intrigued. If well-executed, I even think it might convince some petrolheads to give EVs a try.
In short, Ferrari is rejecting fake engine noise for its first EV and opts for an ‘authentic’ yet improved electric powertrain sound directly generated by the electric motors.
Today, Ferrari released the specs and tech details of its first all-electric vehicle, the Elettrica.
I’ve already posted a detailed article going through the specs, as well as the powertrain and chassis technologies developed by Ferrari for this impressive next-gen EV.
But I wanted to write a separate article specifically about Ferrari’s approach to sound in its first all-electric car because I think its strategy is exciting. I even believe that it could convince some hardcore petrol heads who reject EVs to give them a real shot.
For years, legacy automakers have struggled with how to engineer an auditory experience for EVs that replaces the roar of combustion.
Whether you like them or not, engine sounds are essential, especially in performance vehicles. They are part of the identity of certain cars – a sort of signature. They can be emotional. They can give a sense of power.
But beyond that, they are information. The pitch, volume, and texture of the engine sound provide critical, real-time feedback to the driver about RPM, load, and the car’s health.
Some electric automakers are using curated soundscapes (like BMW with Hans Zimmer) or trying to mimic V8s (like Dodge with its “Fratzonic Chambered Exhaust“). I don’t have a problem with those as long as they are optional, meaning you can turn them off, as I’m not a fan of cars making fake noises.
Other automakers are simply letting the natural sounds of the electric motors exist. There’s nothing wrong with that. However, considering that electric motors produce minimal sounds, which are then trapped inside a metal casing, you rarely hear anything significant, especially in modern vehicles with quiet cabins and even active noise cancellation.
For most EVs, this is not a problem, but for a performance electric vehicle, it does feel like something is missing.
Ferrari’s approach to sound in its first electric car
Ferrari’s solution is a novel one, focusing on what it calls an “authentic voice unique to the electric engine.”
I attended Ferrari’s tech day for the Elettrica, and Antonio Palermo, the brand’s head of NVH (noise, vibration, harshness) and sound quality, gave an excellent presentation about how the company approaches the problem.
He said that there was a lot of internal debate at Ferrari about how to manage the powertrain:
It took us a long time to reach a consensus about what sound to get, but it was clear that we wanted something authentic.
Again, the problem with being authentic with an electric vehicle is that if the powertrain and packaging team did their job right, there’s little sound to play with.
An electric guitar inspired Palermo’s solution. Unlike an accoutic guitar, an electric drive unit doesn’t a hollow body or sound hole to convert the string vibrations into audible sound.
Much like an electric guitar, Ferrari’s solution involves capturing and amplifying the actual vibrations of the drivetrain components. The automaker explained:
A high-precision sensor installed on the rear axle picks up the frequencies of the powertrain, which are amplified and projected into the surroundings as with an electric guitar… the sensor used is an accelerometer installed at a very rigid point on the inverter casting.
This approach, which utilizes an accelerometer to capture solid-borne vibrations from the drive unit, enables Ferrari to amplify a sound that matches exactly what the motors produce – making it authentic.
Ferrari insists the sound will only be used when “functionally useful” to provide feedback to the driver and will be directly tied to torque requests.
In normal driving situations, silence is preferred to maximise acoustic comfort, but when the driver requests torque from the powertrain by accelerating or uses the shift paddles in manual mode, the sound activates to offer dialogue and connection between driver and car.
Palermo added that the latency is non-perceivable to the human ear. In spirited driving, you will be able to hear the motor accelerate, regen, or even decouple since front motors of the Elettrica are equipped with a disconnect to turn the vehicle into a rear-wheel-drive.
The entire system was reportedly developed in-house, giving Ferrari complete control over the vehicle’s final acoustic signature.
Electrek’s Take
This is a fascinating and, frankly, refreshing move from Ferrari. We’ve seen numerous gimmicks from legacy automakers attempting to make their EVs feel and sound like the gas cars they are replacing. Most of them fall flat because they are fundamentally inauthentic.
Ferrari’s “electric guitar” approach is different. By choosing to amplify the real sounds of the electric motor and inverter based on the real vibrations, they are embracing the new technology rather than hiding it. They are making a confident statement that an electric powertrain can be emotionally engaging on its own terms, without having to pretend to be something it’s not.
It’s a brilliant piece of engineering that stays true to the brand’s performance-focused ethos, where sensory feedback is a critical part of the driving experience. And it’s optional. If you prefer a completely silent drive, you can disable it.
The purists who were worried that Ferrari would lose its soul in the EV transition should be encouraged by this.
Ultimately, it could even convert some of those petrol head purists who can’t stand a car experience without the smell of gasoline and the roaring sounds of combustion.
However, we need to hear it first. Everyone who heard it at Ferrari seemed impressed, but they are obviously biased. The test drivers are reportedly enjoying the audio feedback, but the brand is staying secretive.
As I reported in my full article about the Ferrari Elettrica, the automaker is doing the unveiling in three parts. This is just the first part, covering specs and technical details. We will have to wait for the second (Q1 2026) or third (Q2 2026) part to hear about the vehicle.
FTC: We use income earning auto affiliate links. More.

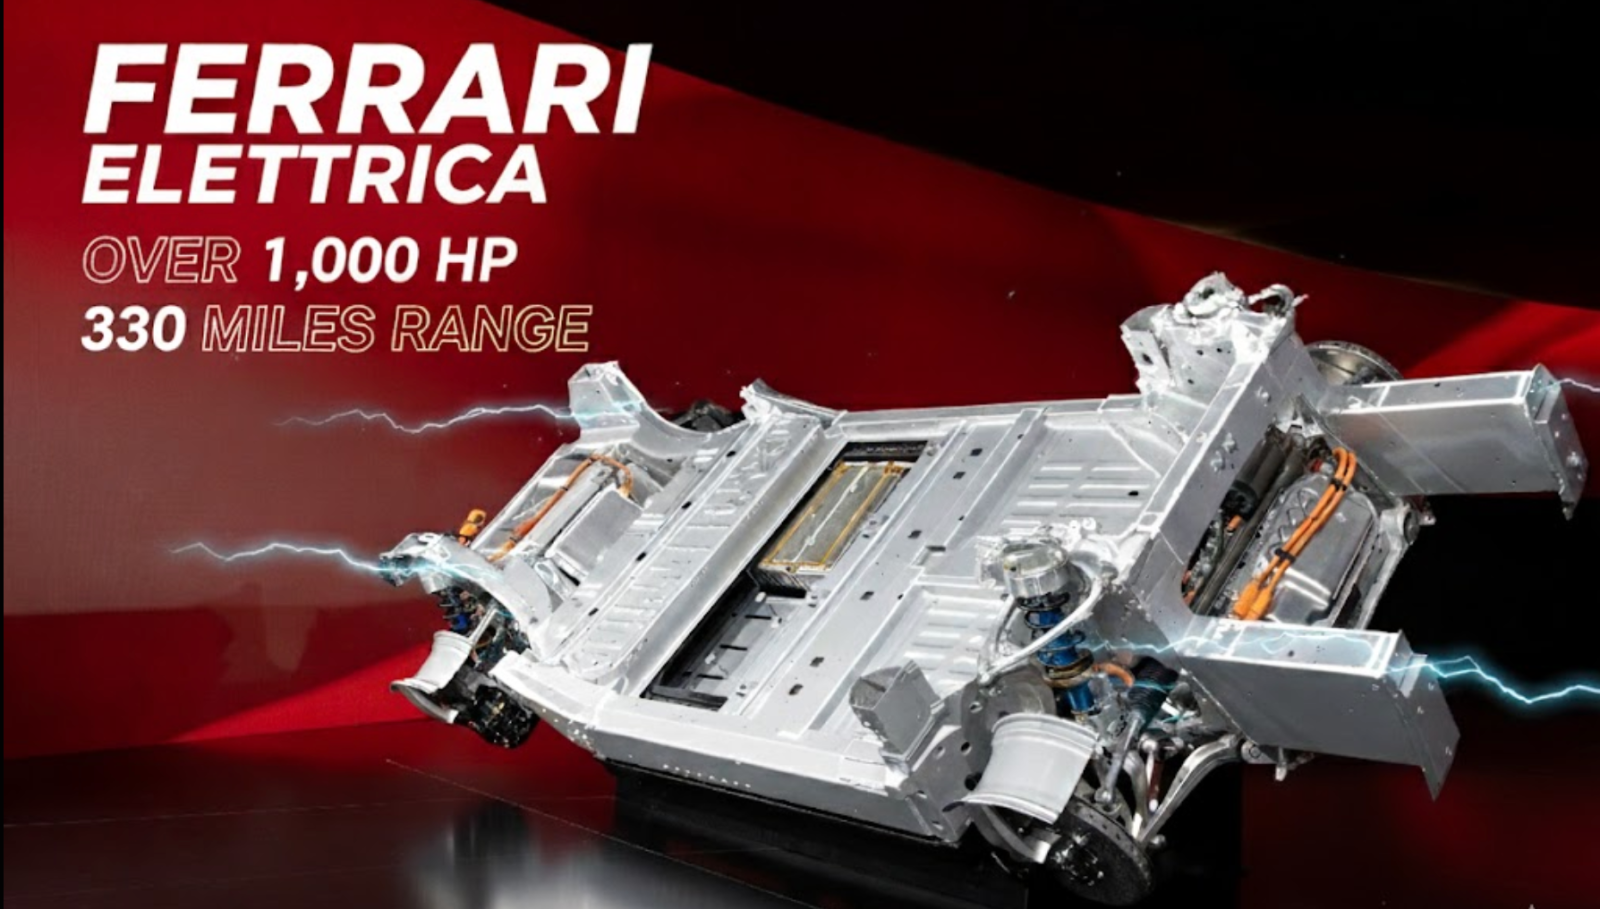
Ferrari has released the specs of its first all-electric car, the Elettrica, and gave us a detailed look at the technology behind it.
You will find the full specs and my take on the event below.
Earlier this week, Ferrari flew me down to its headquarters in Maranello, Italy, along with a few dozen other journalists, to give us a look at the technology the Italian automaker developed for its first electric car: the Elettrica.
Let’s talk about the elephant in the room: we didn’t get to see the car. That will apparently have to wait until the first half of next year. We could only see the chassis and the factory.
With that bummer out of the way, we did learn a great deal about the Elettrica, including its full specifications, as well as the chassis and powertrain technology developed internally for the legendary brand’s first all-electric vehicle.
While many were expecting to see the Elettrica, which may or may not be a placeholder name, by the way, this week, Benedetto Vigna, Ferrari’s CEO, insisted that the vehicle is not late. They want to do a “three-part unveiling” with today being the first part with the specs and tech, a second part will come in Q1 2026 with more details and pricing, and finally, we should see the vehicle in full in Q2 2026.
The CEO assured everyone that the design of the vehicle is already completed.

Vigna is a physicist who was hired to lead Ferrari in 2021. He quickly launched Ferrari’s all-electric vehicle program in partnership with famed designers Marc Newson and Jony Ive’s LoveFrom studio, who will be behind the elusive design of the Elettrica.
A few prototypes were spotted around. I even saw one in Maranello this week, but it is so heavily camouflaged that it is hard to discern anything about the car. It looks to be a sedan or maybe a very low wagon – Purosangue-style, but I’m leaning toward a four-door sedan.
Ferrari confirmed today that it has four doors, it is not a supercar, and it will be mass-produced, to the extent that Ferrari mass-produces vehicles.
Vigna, along with several other executives and engineers at Ferrari, is visibly excited about the brand’s first all-electric vehicle. While touring the new ‘E Building’ on the Maranello campus, where they are building the Elettrica, I saw the CEO visibly giddy while walking around and talking to people about the vehicle program.
He said that today’s release is about explaining all the EV technology that Ferrari has been developing for its first all-electric vehicle.
Let me tell you, it is a lot. I sat through about 5 hours of technological presentations. Here are the highlights.
Ferrari Elettrica – Technical Specs
First, here are all the specifications. I know most of you will stop reading here anyway – might as well get it out of the way. The headline-grabbing specs are: over 530 km (330 miles) of range thanks to a 122 kWh battery pack, 0 to 100 km/h in 2.5 seconds thanks to a quad-motor powertrain with over 1,000 hp (830 kW), and a top speed of 310 km/h (186 mph).
Here are the full specs:
| Specification | Value |
| Performance | |
| 0-100 km/h | 2.5 s |
| Top speed | 310 km/h |
| Power | >1000 cv in boost mode |
| Range | >530 km |
| Dimensions and Weight | |
| Wheelbase | 2960 mm |
| Weight | circa 2300 kg |
| Weight distribution | 47% front / 53% rear |
| Front E-Axle | |
| Power at the axle | 210 kW |
| Torque at the wheels | 3500 Nm |
| Torque at the engine | 140 Nm in Performance Launch mode |
| Power density | 3.23 kW/kg (93% efficiency) |
| Engine revs | 30,000 |
| Maximum inverter power | >300 kW |
| Weight | 65 kg |
| Rear E-Axle | |
| Power at the axle | 620 kW |
| Torque at the wheels | 8000 Nm |
| Torque at the engine | 355 Nm in Performance Launch mode |
| Power density | 4.80 kW/kg (93% efficiency) |
| Engine revs | 25,500 giri/min |
| Maximum inverter power | >600 kW |
| Weight | 129 kg |
| Battery | |
| No. of cells | 210 (15 modules with 14 cells) |
| Total power density | 195 Wh/kg |
| Cell power density | 305 Wh/kg |
| Gross capacity | 122 kWh |
| Maximum voltage | 880 V |
| Maximum recharge power | 350 kW |
The tech behind Ferrari’s first all-electric car
My main takeaway from this event is that Ferrari is becoming a complete electric automaker, which is a remarkable thing to say about a brand that pioneered the V12 combustion engine 80 years ago.
It is not buying an electric powertrain and integrating it into a vehicle with a Ferrari-tuned chassis. Numerous automakers have done so, and there are ways to create some truly incredible electric cars like that with the help of suppliers and automakers packaging some excellent electric powertrains these days.
But Vigna made it clear that Ferrari wants to own its EV technology and advance it with innovation.
The Italian automaker has developed and is producing almost the entire powertrain. Ferrari is purchasing the NMC pouch cells from South Korea’s SK. I even saw the battery cell crates with SK logos lying around the factory. And then, it makes the entire battery module and pack from there.
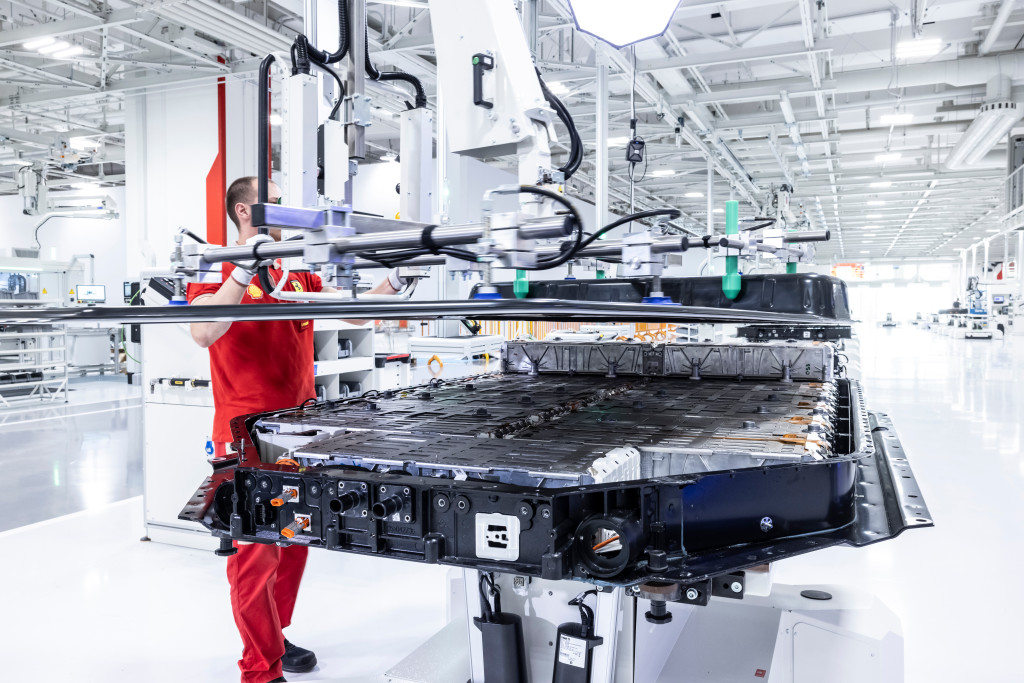
For the pack, Ferrari has prioritized safety, with a significant amount of energy absorption and redistribution around the modules, followed by weight optimization and performance.
The automaker explained:
The layout of the cells is designed to minimise inertia and lower the centre of gravity, placing them where possible behind the driver seat. 85% of the weight of the modules is situated under the floorpan, while the remainder is located under the rear seat: a solution that made it possible to shorten the wheelbase and minimise inertia to maximise driving pleasure in all situations, with an optimal weight distribution of 47–53%.
During presentations related to the pack and modules, several engineers mentioned making the Elettrica a “forever EV” by utilizing battery modules that are easy to service and replace.
Ferrari is even making its own motors for the Elettrica:
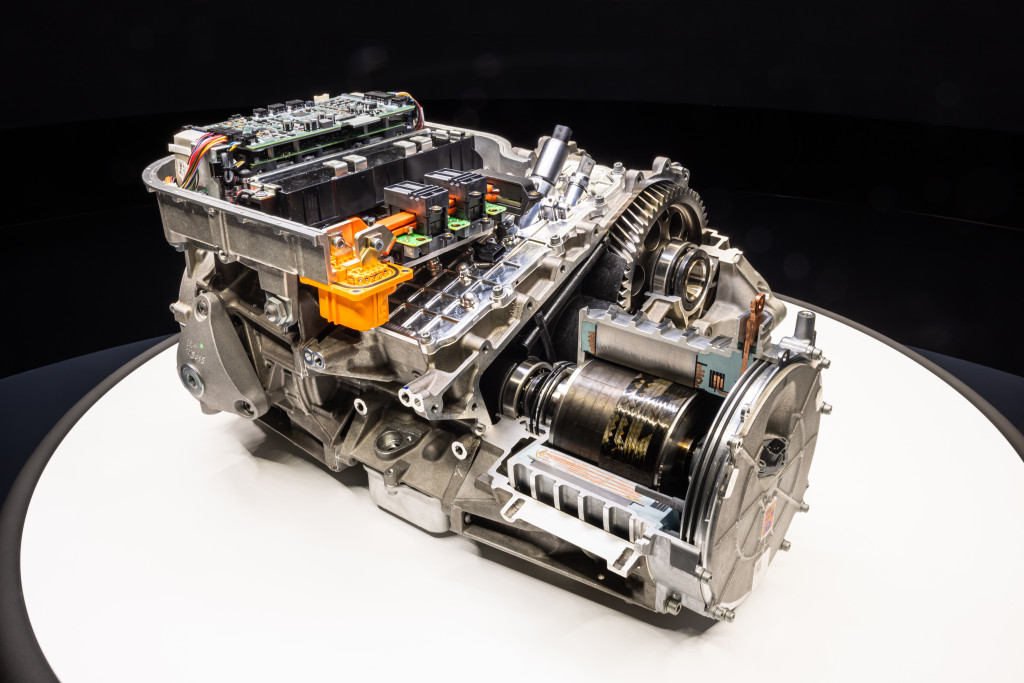
For the motors, Ferrari went all out and leaned heavily on its motorsport experience.
While this is Ferrari’s first all-electric vehicle, the company has extensive experience with various electric powertrains, dating back to its F1 car in 2009.
First, let’s discuss the specs, as they are staggering. The motors achieve incredibly high rotational speeds—the front axle motor spins up to 30,000 rpm to produce 105 kW, while the rear hits 25,500 rpm for a massive 310 kW peak power (remember, that’s time two since there are two motors per axle). Reaching these speeds enables the motors to remain extremely compact, which is crucial for a space-saving axle architecture.
The secret sauce is in the materials and design. The rotor employs a motorsports-derived Halbach array configuration using segmented, surface-mounted permanent magnets. For those unfamiliar, this is a highly sophisticated design that strategically directs the magnetic flux toward the stator. The result is a massive boost in torque density while simultaneously reducing the motor’s overall weight—a win-win for any performance EV, but difficult to manufacture.
The stator technology is equally advanced. It’s constructed from ultra-thin 0.2 mm non-oriented grain silicon-iron laminations. These are stacked using a self-bonding process that minimizes the risk of short circuits, a critical detail for durability and efficiency.
To further reduce energy loss, especially under high load, the windings use a Litz wire configuration. This specialized wiring is designed to mitigate the “skin and proximity effects” that reduce the efficiency of conventional motors at high frequencies and currents. It’s an expensive but necessary choice for a powertrain operating at this level, ensuring that the incredible power potential isn’t wasted as heat.
The front drive unit is equipped with a disconnect that enables the Elettrica to switch between rear-wheel driving and all-wheel driving within half a second.
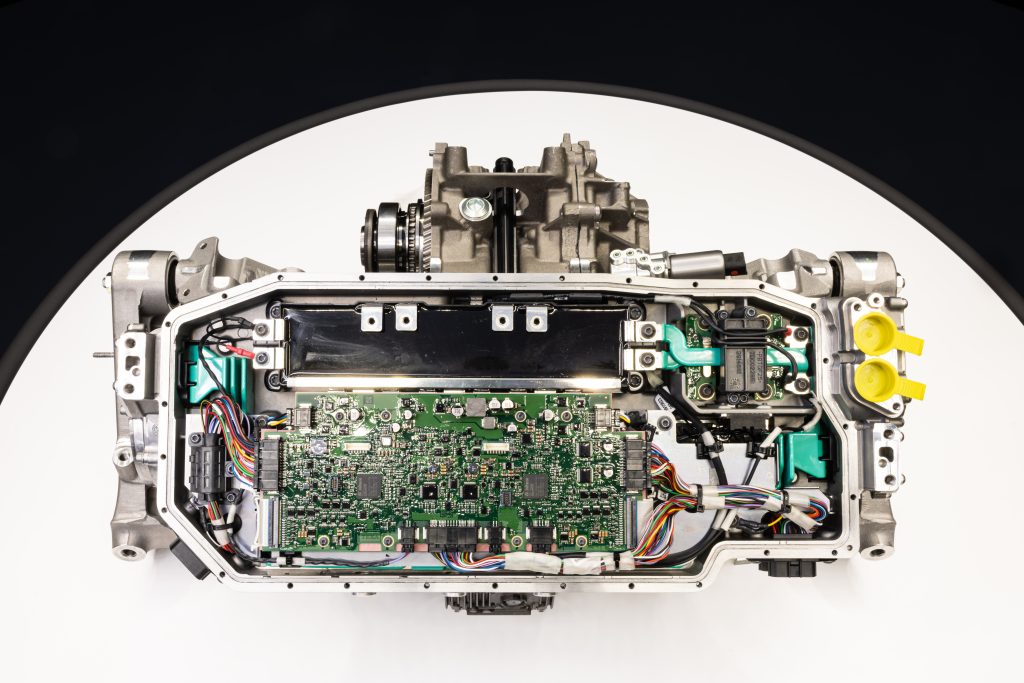
Powering the four motors on two axles, Ferrari developed its own power inverters – seen above.
Using silicon carbide (SiC), Ferrari’s inverter achieves a 93% efficiency at max capacity and weighs only 9 kg.
The automaker wrote about the system:
The driver board is the interface between the high- and low-voltage sides and manages the behaviour of the power MOSFETs. Each board drives three modules, each consisting of 16 MOSFETs, which, alongside the integrated 800 V – 48 V DC/DC converter, ensure precision and responsiveness in the distribution of torque to the pair of engines. The inverter switching frequency, which varies from 10 to 42 kHz depending on the specifications of the application, has been painstakingly calibrated to balance efficiency, acoustic comfort and heat management, and to optimise engine response without compromising the overall integration of the system.
Overall, the powertrain appears to be top-of-the-line. Some might question why it doesn’t have 2,000+ horsepower, as some other hypercars launched over the last few years do, but it’s clear that Ferrari was not aiming for just pure power.
The automaker is balancing power with a sensible weight that makes sense to deliver the handling and cornering capabilities the brand is known for.
As Gianmaria Fulgenzi, Chief Product Development Officer, put it during one of the presentations, Ferrari wants to deliver “driving thrills” with its first EV. Packing an EV with power and batteries to go 0-100 km/h in 1.9 seconds is relatively easy. Making it so that it handles greats while delivering repeatable power is a different animal.
When it comes to the suspension, the fact that it’s an EV doesn’t have a significant impact, and Ferrari was able to use a lot of its existing expertise here.
In fact, the Elettrica uses the same Ferrari third-generation active 4-volt electric suspension found in the latest F80 and Purosangue – with a few adjustments to better adapt to and take advantage of the lower center of gravity.
The main difference is a 20% pitch increase of the threads inside the system to reduce the inertia transfer into the chassis.
Sensors detect the road with a one-millisecond latency, and the system can take action within five milliseconds.
Ferrari utilizes this feature for both performance and comfort, which can be easily adjusted with a button on the steering wheel.

Funny enough, the coil you see in this picture is only there to support the vehicle when it is turned off. Otherwise, the electric suspension actively does everything when the car is powered on.
In the back, the suspension is linked to a new, separate subframe. Ferrari opted for this design to gain more control over the transfer of vibration to the chassis – a consideration that ICE automakers tend to be more cautious about with electric vehicles, as non-powertrain noises and vibrations are more noticeable.
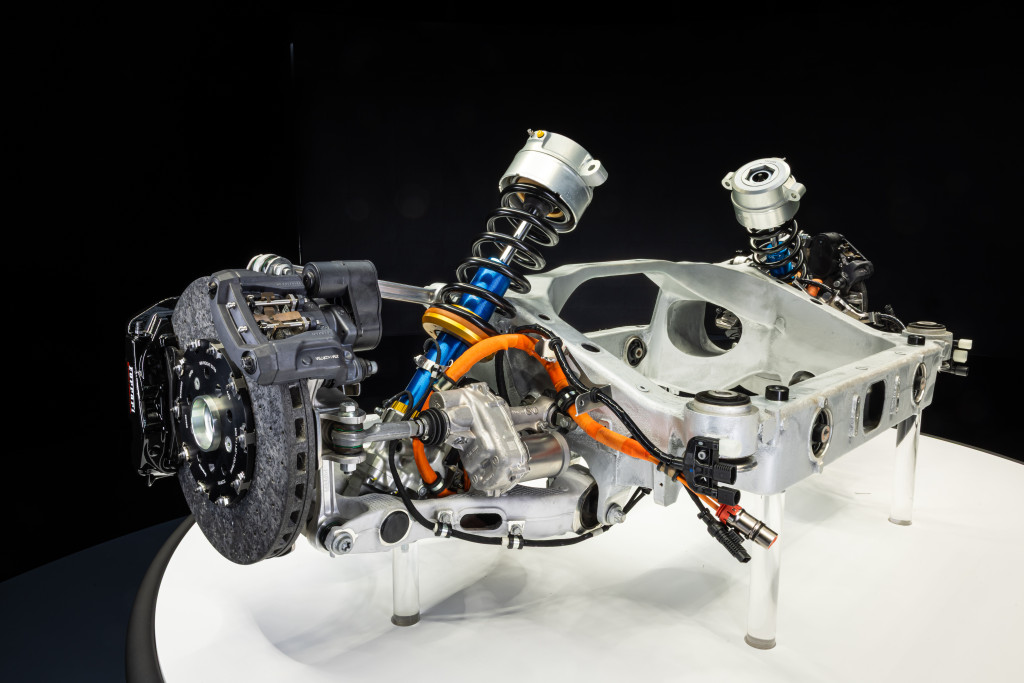
The rear axle is also particularly noteworthy for its independent rear steering, which can be adjusted up to 2.15 degrees.
Between the four independent motors, four independent active suspensions, and steering at each wheel, Ferrari finds itself having incredible active control on all axes of each wheel of the Elettrica.
All of these systems are controlled by a single central control unit, enabling synchronous, targeted actions for performance or comfort.
For now, we can only imagine what Ferrari can do with this system, but I bet it will be impressive.
Electrek’s Take
For the most part, I am impressed. Execs kept saying the word “unique,” and in a sense, every new car is somewhat unique. However, none of these specs or tech are particularly unique on their own.
All together, they make for an impressive electric vehicle, but I would expect that for an EV in that price range. Ferrari has not announced any price yet, but based on how they are positioning this product within their lineup, I would expect it to start between $300,000 and $500,000.
Now, the last feature I discussed in my article —the capacity for actively control each wheel on all axes; up and down with active suspension, left and right with steering front and rear, and forward and backward with torque vectoring —is something auspicious. If well executed, it could result in one of the best driving experiences in an EV, or any car, ever. That would be unique.
I also do like the idea of Ferrari hiring a scientist as CEO who then quickly spearheaded this EV program and made Ferrari develop whole new expertises. He appears genuinely excited about it and the excitement has spread throughout the company.
During the event, I’ve met several engineers working on EV componements, especially the motors, who seemed to be top players.
The design remains a mistery and while the parntership with LoveFrom is intriguing, it could be a hit or miss. As far as I know, neither Ive or Newson ever designed a production car. My understanding is that they are working with car designers and providing leadership to the project, but nonetheless, there’s room to be skeptical even though those guys are undoutedly accomplished designers.
We will have to wait for part 2 and 3 of Ferrari’s Elettrica unveiling to get a better idea.
There’s one last thing that I want to discuss that I think could have a singificant impact on the EV industry. I am talking about Ferrari’s approach to sound with its first EV. If succesful, I think it could move the needle in convincing some hardcore petrol heads that EVs are
I really respect the approach. I wanted to go into more detail so I wrote a standalone article about it here.
I’d love to read your thoughts about the Ferrari Elettrica in the comment section below and specifically about the approach to sound in the other article.
FTC: We use income earning auto affiliate links. More.


GM has unveiled the new version of the Chevy Bolt, its popular, affordable EV with an upgraded battery and an otherwise very similar package to its last iteration, and we’re on the scene at the unveiling at Universal Studios Hollywood to get you all the info you need.
The Chevy Bolt was originally released in the 2017 model year. It was GM’s first real, modern effort at an EV, designed to be all-electric rather than a compliance car like the old Chevy Spark EV. (GM did previously design the EV1 from the ground up, but it came along before the lithium ion era of EVs, and was decidedly a compliance car).
It was also a great car. Not only was it a good size unlike the ridiculous land yachts we’re seeing so many of today, it had a phenomenal price, especially near the end of the model’s life. It was good enough to be Electrek’s vehicle of the year for 2022.
But, due to an extended recall and because the Bolt used GM’s first-gen EV platform, rather than its whiz-bang new “Ultium” system, GM retired the vehicle in late 2023, even though it was having its best sales year ever.
But, that wasn’t the end for the model. After declaring the Bolt dead but before ending production on it, GM said that it would bring back an Ultium-based Chevy Bolt (which our publisher Seth Weintraub has taken to calling the “Boltium”).
And now, it’s finally time for the official unveiling, and we’re on hand at Universal Studios Hollywood for a “Bolt Block Party” showing off the new vehicle.
Meet the new Bolt, same as the old Bolt
When Chevy retired the Bolt and said they would bring it back later, we expected it to be similar, but perhaps not this similar. From the exterior, the new Bolt and the old Bolt EUV are nearly indistinguishable.
The front fascia is slightly modified with a black line between the headlights and no black border around the fake grille, and the rear has different taillights (lifted higher, a big demand from Bolt owners), and slightly more paint on the bumper. That’s about it. But we knew all that already, after seeing it charging in public last week.
Now we’re getting information on the interior and specs, which are the juicy updates we were hoping to hear changes on.
GM hasn’t publicized 0-60 times yet, but the Bolt will use the same motor as the Equinox EV, which gives 210hp. That’s about the same as the previous Bolt, and it weighs a similar amount, so we’re imagining similar performance as the 6-ish seconds 0-60 of the previous Bolt – peppy and more than enough for any daily needs, but not a sportscar.
In particular, the original Bolt’s main technical limitation was its low DC charge speed. It maxed out at 50kW, but often was even slower than that. In a world where many vehicles can now charge at 200kW+ speeds, the new Bolt needed an update.
Thankfully, it got one. The new Bolt is now capable of a 150kW charge rate, with a 10-80% charge in 26 minutes. GM says this is about three times faster than the previous generation.
This is due to a new 65kWh LFP battery, utilizing GM’s Ultium EV platform. The previous Bolt used LG cells, and was built before GM developed Ultium. This led the Bolt to be the only vehicle in GM’s EV stable on a different technology, and is what necessitated its retirement and retooling.
The new battery also offers different specs, with 255 miles of range (GM estimate). That’s a bit more than before, which is nice, plus you can charge to 100% every night because it’s LFP. But the DC charge speeds are really the bigger story here. Faster DC charge rates enable more seamless roadtrips.
Further enabling those roadtrips is the Bolt’s new NACS port, allowing it to use the Tesla Supercharger network. An adapter is still available to use on CCS networks, but Superchargers are typically a better experience, and the whole industry is moving in that direction at this point.
Another major change is in the Bolt’s software. The previous one had CarPlay, but this one won’t.
A lot of people are unhappy about that, and I understand the unhappiness. People have gotten used to CarPlay (or Android Auto), and lots of people love it, because it’s so much better than the software from whatever 2010s-era vehicle they came from. Infotainment systems have been horrendous in vehicles for a long time.
However, I argue that these phone-based car UIs aren’t actually that great. They are inherently generic, and unable to be tied deeply into vehicle functions in a way that provides a single coherent interface. That’s why I actually liked the UI in the Blazer EV, GM’s first implementation of its post-CarPlay solution, and continue to think that GM made an acceptable choice here.
So, I do think the Bolt UI will turn out okay. GM may take a little time to iron out some kinks, but in the longer term, I think this solution is better, and will enable over-the-air updates which saves time and trouble for everyone.

The interior has had a refresh with larger display, added ambient lighting, and cupholders which can be rearranged to accommodate larger cups. It also has more dash storage for passengers.
Rear cargo space is the same as the outgoing Bolt EUV at 16 cubic feet with the seats up, or 57 with the seats down. Incidentally, with the seats down, this is actually the same amount of cargo space as the Equinox EV, which is 20 inches longer than the Bolt. Quite a feat of packaging efficiency here.
Finally, and perhaps most importantly, the price. Chevy says the launch edition will be a limited run at $29,990, and then later will be accompanied by an LT trim with base price $28,995. That’s quite an attractive price, and as of right now, makes it the cheapest EV announced in America.
Electrek’s Take
One interesting thing about this unveiling is its timing – or rather, the timing of another unveiling which happened just about 24 hours ago. That’s when Tesla finally took the wraps off its long-promised “more affordable” EV, which turned out to just be a stripped-down version of its Model 3/Y with a still disappointingly-high $37k-$40k base price.
Tesla’s timing for that announcement could have been an attempt to steal the wind from the Bolt’s sails, but given the pricing of that vehicle compared to this one, we’re thinking that there may not be much cannibalization.
My main disappointment in the Bolt is that the new model is based on the EUV version, rather than the EV version. The previous iteration of the Bolt originally came in a smaller version dubbed the EV, with a six-inches-longer EUV version coming later. The EV actually sold in higher numbers than the EUV throughout the model’s life, but it was also available for longer.
But when Chevy announced it would bring back the Bolt, it said the new version would be EUV-only. At the time I found this folly, and I still do. We need smaller cars, not larger ones. While the EUV is still a more reasonably-sized vehicle than almost anything else on the road, I am still disappointed that it is moving in the wrong direction as far as size goes.
Nevertheless, in the current US environment where everyone seems determined to make using roads as unsafe as possible, the EUV is still smaller than the vast majority of cars available
And the price, well, that’s really the kicker. After republicans raised the price of every EV by $7,500 during an affordability crisis, with unwise tariffs also inflating consumer prices at the same time, it’s getting harder to buy a vehicle.
But the Bolt now joins the fray as one of the most affordable EVs out there, alongside the new Nissan Leaf which will cost under 30k (and even less, once a future lower-spec trim is announced), and significantly cheaper than other low-ish-priced EVs like the Equinox EV, Ioniq 5, and the aforementioned “more affordable” standard Model 3/Y.
That’s a big deal, and it makes the new Bolt a similar calculation as when it earned Electrek’s Vehicle of the Year. But now, it doesn’t even have the main downside it had at the time – its low DC charge rate, and battery questions during what was a messy recall. Both of those problems were solved here, leaving a calculation with few downsides.
We haven’t driven the car yet, though we’ll get a few minutes in it later in the event. But it’s only going to be around the block at the Universal backlot, so we can’t give a full review, but from what we’ve seen today, it looks like quite an attractive value proposition.
We’re still at the event right now for the next few hours, so if you’ve got any questions that you’d like us to check on or relay to GM employees, let us know in the comments and we’ll see if we can get some answers (especially you Bolt owners). And, we just got all this info, so we’ll be updating this article as we digest more.
The 30% federal solar tax credit is ending this year. If you’ve ever considered going solar, now’s the time to act. To make sure you find a trusted, reliable solar installer near you that offers competitive pricing, check out EnergySage, a free service that makes it easy for you to go solar. It has hundreds of pre-vetted solar installers competing for your business, ensuring you get high-quality solutions and save 20-30% compared to going it alone. Plus, it’s free to use, and you won’t get sales calls until you select an installer and share your phone number with them.
Your personalized solar quotes are easy to compare online and you’ll get access to unbiased Energy Advisors to help you every step of the way. Get started here.
FTC: We use income earning auto affiliate links. More.
-
 Sports3 years ago
‘Storybook stuff’: Inside the night Bryce Harper sent the Phillies to the World Series
-
 Sports2 years ago
Story injured on diving stop, exits Red Sox game
-
 Sports2 years ago
Game 1 of WS least-watched in recorded history
-
 Sports3 years ago
Button battles heat exhaustion in NASCAR debut
-
 Sports3 years ago
MLB Rank 2023: Ranking baseball’s top 100 players
-
Sports4 years ago
Team Europe easily wins 4th straight Laver Cup
-
 Environment2 years ago
Japan and South Korea have a lot at stake in a free and open South China Sea
-
 Environment1 year ago
Here are the best electric bikes you can buy at every price level in October 2024