

US oil is back, and ExxonMobil’s $60 billion deal isn’t even the biggest signal

Workers connect drill bits and drill collars used to extract oil in the Permian basin outside of Midland, Texas.
Brittany Sowacke | Bloomberg | Getty Images
After three and a half years, a tripling in the S&P 500 Energy Index, and many soon-to-be-forgotten culture-war volleys, the U.S. Department of Energy announced Oct. 12 that U.S. crude oil production had hit an all-time high of 13.2 million barrels per day, entirely wiping out Covid-era losses of more than 3 million barrels per day.
The news came a day after a $60 billion deal between Exxon Mobil and independent oil producer Pioneer Natural Resources. The combination of recovering production, sustained pressure from Wall Street for cost containment and high stock dividends, and consolidation like the Exxon-Pioneer hookup is not a coincidence.
The energy sector’s big stock move in 2021 and 2022 was mostly a recovery from a disastrous decade for Big Oil, when tens of billions of cash flow were lost on unprofitable fracking wells, and of a consolidation that was good for company profits, dividends and shareholder returns.
The foundation of the 2010s oil business was cracking when Covid broke it, said Rob Thummel, senior portfolio manager at Tortoise Ecofin in Kansas City, Mo. Monthly production topped out at 13 million barrels per day in November 2019 and hit 9.9 million by February 2021.
“Capital discipline in the U.S. industry hasn’t gone away, and oil is at $85 to $90 a barrel,” he said.
So, what brought Big Oil back, and what’s next?
Here are seven important factors that played into U.S. oil’s recent history and will influence its future.
Why the shale drilling bust ended
Oil broke gradually and then suddenly. The S&P 500 Energy Index lost 40% of its value between 2014 and 2019. But the pandemic drove the fast part of the bust, in part by leading Wall Street to insist on further cuts in capital spending, Thummel said.
Loading chart…
What brought it back was renewed demand and higher prices.
Recessions end, and oil demand has slowly rebounded after the 2020 downturn and lingering supply-chain shock. And rising prices for WTI crude – which careened during Covid to less than $15 a barrel, shot back to $120 in 2022, and is now near $90 – can make previously-unprofitable plays work, he said.
The U.S. production rebound is more concentrated
Big Oil isn’t back all over America: Production is still down sharply in Oklahoma and North Dakota. It hasn’t changed much in Alaska, where production is in a long-term tailspin. And offshore oil drilling in the Gulf of Mexico recovered to 2 million barrels a day, but hasn’t grown.
Instead, the surge is concentrated in the Permian Basin region of Texas and New Mexico, where production costs are among the lowest in the country, said Alexandre Ramos-Peon, head of shale well research at Rystad Energy. Oil from the Permian Basin costs an average of $42 a barrel to produce, he said, with North Dakota in the high $50s to $60.
North Dakota is also hampered by weaker access to pipelines than the Permian Basin, where many producers can use pipelines that lie entirely within Texas, skirting federal regulation of interstate pipelines. That’s only one example of a relaxed regulatory environment in Texas, compared to places like climate-conscious Colorado, the nation’s No. 4 oil producer, where output is still down 3 million barrels per month, said Jay Hatfield, CEO of Infrastructure Capital Advisors in New York.
“There’s this place called Texas that doesn’t really know what energy regulation is,” he said.
Where oil companies have been spending their money
U.S. oil companies cut capital spending to $106.6 billion last year from $199.7 billion in 2014, according to Statista, contributing to the decline in oil production and arguably delaying the recovery. And they put that money to work paying higher dividends and doing stock buybacks, Thummel said.
According to Energy Department data, oil and gas companies paid out about $75 billion per quarter in the last year. The share of oil-company operating cash flow going to shareholders rose to half of operating cash flow from about 20% in 2019, the department says.
The link between Exxon-Pioneer deal and peak barrels
Offsetting the decline in capital spending is higher productivity per well — while all of the U.S. oil production is back, the closely watched Baker-Hughes rig count is barely half of 2018 levels. The average production per rig of new wells just topped 1,000 barrels a day, up from 668 four years ago, according to the Energy Department. So the industry didn’t have to add a ton of new wells or drill in as many new places to recover fully.
On CNBC last week, ExxonMobil CEO Darren Woods said the company did the merger because it thinks its technology and scale can raise the productivity of Pioneer’s fields.
“Their [Pioneer’s] capabilities, bringing in their Tier 1 acreage, our technology, our development approach, frankly, brings higher recovery at lower cost,” Woods said.
That suggests more mergers to come as rivals like Chevron also make plays to boost their presence in U.S. shale, especially in the Permian Basin, Hatfield said. Chevron already has made several shale-related acquisitions in recent years, including $7.6 billion for PDC Energy this year and $5 billion for Noble Energy in 2020. Independent producers are under more pressure than more-stable super-majors to pay very high dividends to justify the risk of oil-price fluctuations, which will mean tighter constraints on their ability to keep up in technology and scaling of operations, he said.
U.S. crude, energy security and Big Oil economics
As a result of the rebound in crude, is American repatriating its oil? A little, says Hatfield. Permian shale right now is much cheaper to produce than offshore oil, comes with much less political risk than offshore drilling in much of the developing world, and takes much less time to make a profit than offshore wells. That’s leading companies like Exxon to bet more heavily on Permian shale than offshore drilling, he said.
“The super-majors are taking capital out of offshore,” Hatfield said. “They are reducing overseas development because it is more risky.”
The biggest part of the equation is that time equals risk, Ramos-Peon said. Global oil producers aren’t squeamish about investing in parts of the world where governments change, but the years-long investment cycles in offshore drilling make the much shorter turnarounds in Texas appealing to companies like ExxonMobil, which is one of the industry’s biggest offshore players.
“In the Permian, you get your capital back in a little over a year,” Hatfield said. “The return on investment is much faster and much higher because the wells begin to produce so quickly.”
What oil’s recent trading and Israel-Hamas mean for gas prices
Gas prices tend to move in tandem with the price of crude oil, which has dropped to about $88 per barrel from $94 in September, driving a 20-cent per gallon drop in the nationwide average price for regular. But the influence of OPEC, whose coordinated production cuts in June have driven prices up 35 cents, often offsets what domestic producers do, Ramos-Peon said. And right now there is the added uncertainty of whether the Israel-Hamas war will result in a slash in production from Iran, whose government supports the Hamas rebels who launched bloody attacks into Israel, he said.
“I believe crude prices will stay around the current level in the short term, and in the long term should trend down,” he said. “If there are sanctions against Iran, that will be bad for consumers.”
Short-term shale plays, oil consumption and climate change
What’s good for oil companies in the short-term doesn’t change the longer-term trajectory of the oil market or carbon reduction.
Meeting climate goals has more to do with long-term shifts in energy use than with short-term production targets, Ramos-Peon said. Rystad expects U.S. production to rise to 13.6 million barrels per day next year and 13.9 million in 2025, he said. After that, forecasts get more difficult because so much can change, but by late this decade oil consumption should peak before beginning to ebb, he said.
Even as more cars go electric, demand from older cars and uses of oil in chemicals will keep the oil business very large, Ramos-Peon said. And the risk that the business will erode will make drillers focus on shale more than offshore drilling, Hatfield said
“In the context of not knowing for sure, why wouldn’t you want a return on your investment in three years rather than 30?” he said.
Short-term, the biggest threat to the rosy scenario is that oil-industry cash flows are falling sharply from a peak last year. The Energy Department says its survey of 139 producers, foreign and domestic, shows a 36% drop in second-quarter operating cash flows from 2022. Profits are narrowing for the first time in two years, the department said.
Then again, the price of crude has risen $16 a barrel since the end of the second quarter. And in the oil business, price rules everything.


Delta Air Lines is teaming up with Dutch aviation startup Maeve Aerospace to take its idea for a more advanced, fuel-sipping hybrid-electric aircraft powertrain from the drawing board and into regional commercial service.
Delta Air Lines announced a new partnership with Maeve Aerospace meant to accelerate certification and deployment of the startup’s next-generation hybrid-electric regional aircraft – a move that could reduce the company’s fuel consumption on those routes by up to 40% compared to ICE-only assets.
“Delta is proud to collaborate with Maeve to help shape the next chapter of regional aviation and accelerate progress toward a more sustainable future of flight,” said Kristen Bojko, Vice President of Fleet at Delta Air Lines. “As we work toward the next generation of aircraft, we look to partners like Maeve who embody the bold, forward-thinking innovation we champion at Delta – solutions that advance aircraft design, enhance operational efficiency, elevate employee and customer experiences, and cut emissions. While driving toward transformative technologies that strengthen our network and redefine regional air travel remains a key priority, we’re equally focused on safety and a more sustainable future of flight.”
The collaboration positions Delta among a growing list of carriers investing in lower-carbon emission aviation tech as regulators, passengers, and activist investors alike push for cleaner operations.
Maeve M80 hybrid

Maeve introduced its M80 hybrid-electric, 80-seater aircraft in November of 2023 as a sustainable, cost-effective aircraft designed to satisfy the operational needs of the majority of regional operators and airports.
As designed, the M80 promises an operating range of more than 900 miles (~1,500 km) with 40% higher fuel efficiency than conventional aircraft. Similar in concept to the way Toyota’s Prius uses its electric motors to accelerate and cruises on a small ICE engine, the Maeve’s hybrid engine architecture provides additional electric power assistance at low altitude, high-drag flight.
The M80’s electric motors can also be used during taxiing operations on the ground to reduce surface-level carbon emissions while also supporting a more efficient integration of more electric aircraft systems. Two facets of the aircraft’s designs that are specifically called out by Delta’s press material as being of extreme interest to the commercial carrier.
“It’s a privilege to have Delta as a partner in the development of groundbreaking technologies and processes,” shared Martin Nuesseler, Chief Technology Officer at Maeve Aerospace. “Their expertise in fleet innovation and commitment to aviation sustainability is unmatched, and we’re proud to work together to tailor the MAEVE Jet for the US market.”
SOURCE | IMAGES: Delta.

If you’re considering going solar, it’s always a good idea to get quotes from a few installers. To make sure you find a trusted, reliable solar installer near you that offers competitive pricing, check out EnergySage, a free service that makes it easy for you to go solar. It has hundreds of pre-vetted solar installers competing for your business, ensuring you get high-quality solutions and save 20-30% compared to going it alone. Plus, it’s free to use, and you won’t get sales calls until you select an installer and share your phone number with them.
Your personalized solar quotes are easy to compare online and you’ll get access to unbiased Energy Advisors to help you every step of the way. Get started here.
FTC: We use income earning auto affiliate links. More.

Utilities, state governments, and private developers are racing to roll out faster, more powerful EV chargers. At the same time, automakers and tech giants across the globe are pouring billions into R&D to develop batteries that can take ever-higher levels of power. But what if there’s a better, easier, cheaper, and more effective way to cut emissions?
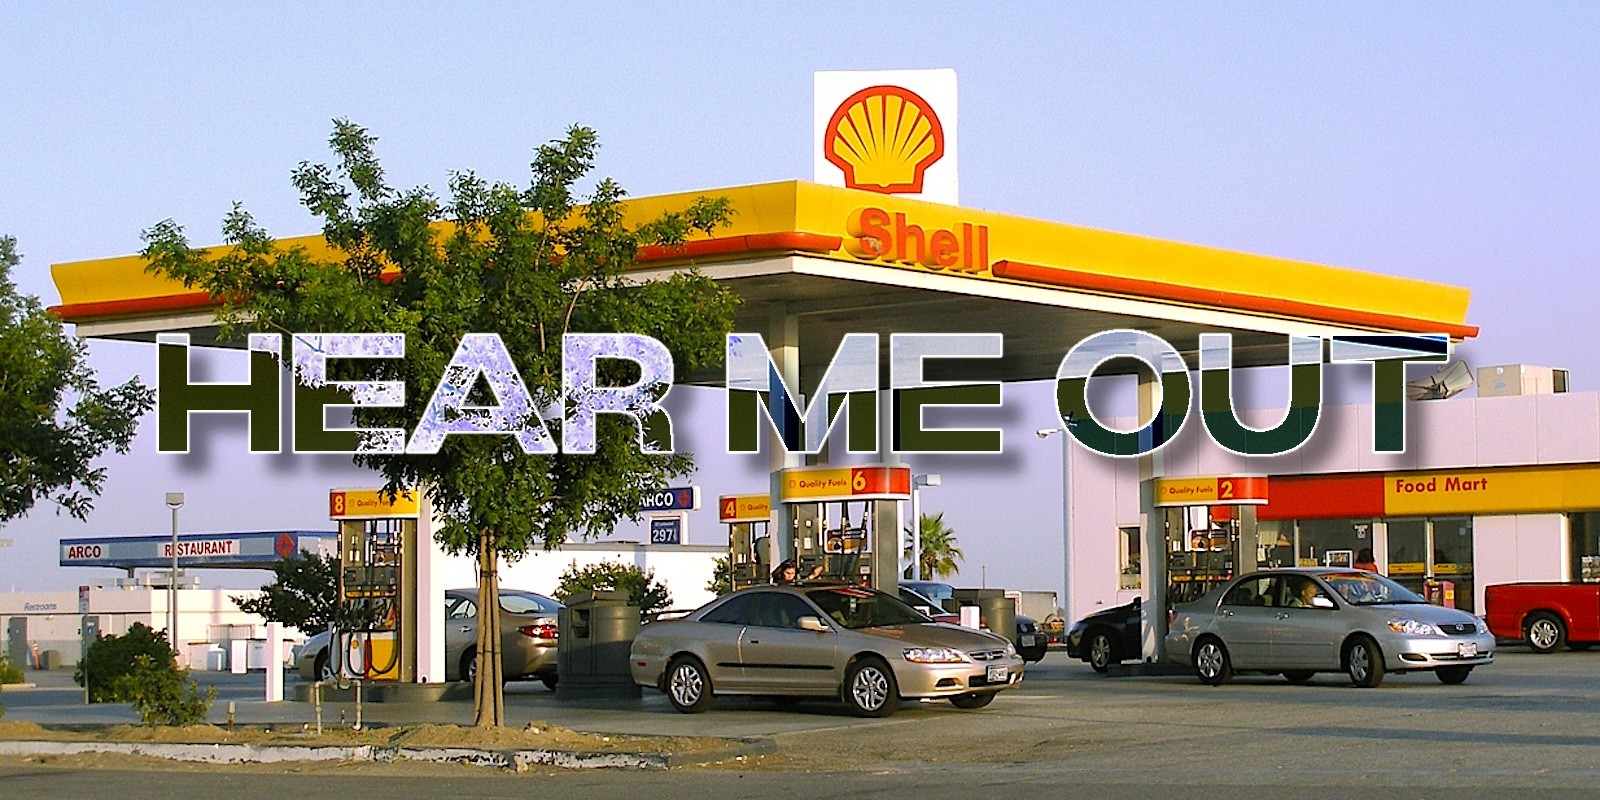
What if, instead of faster chargers, we pushed for SLOWER gas pumps?
I want to start this conversation by pointing out that there’s a precedent for this idea. Back in 1993, the Environmental Protection Agency (EPA) finalized a rule that limited the rate that gas service stations could pump fuel to a maximum of 10 gallons per minute (gpm), with the stated goals of reducing evaporative emissions and promoting safety by ensuring the integrity of the nation’s refueling infrastructure.
Officially dubbed “61 FR 33033 – Regulation of Fuels and Fuel Additives: Controls Applicable to Gasoline Retailers and Wholesale Purchaser-Consumers; 10 Gallon Per Minute Fuel Dispensing Limit Requirement Implementation,” the rule was finalized in January of 1993 and went into effect in 1996. Now, almost thirty years later, I think it’s time to revisit 61 FR 33033 in a way that helps reduce emissions even more.
To zero.
The pitch
The basic idea is this: instead of “just” asking for utility rate-payers and State or local governments to help cover the costs of rolling out an increasingly huge EV charging infrastructure that will never be big enough to convince the red hats it’s ready, anyway, we focus our lobbying efforts on slower gas pumps in blue states. Like, significantly slower gas pumps.
By reducing the maximum pumping speed from 10 gpm to 3 gpm, we could increase the minimum time to fill up a half-ton Ford F-150’s 36 gallon fuel tank (yes, really) from under four minutes to nearly twelve (12). Factor in the longer wait times ICE-vehicles would have to endure waiting in line to refuel, as well, and we’re talking about a 20-30 minute turnaround time to go from just 10% to a usable 80-or-90% fill.
Y’all see where I’m going with this?
Everybody wins
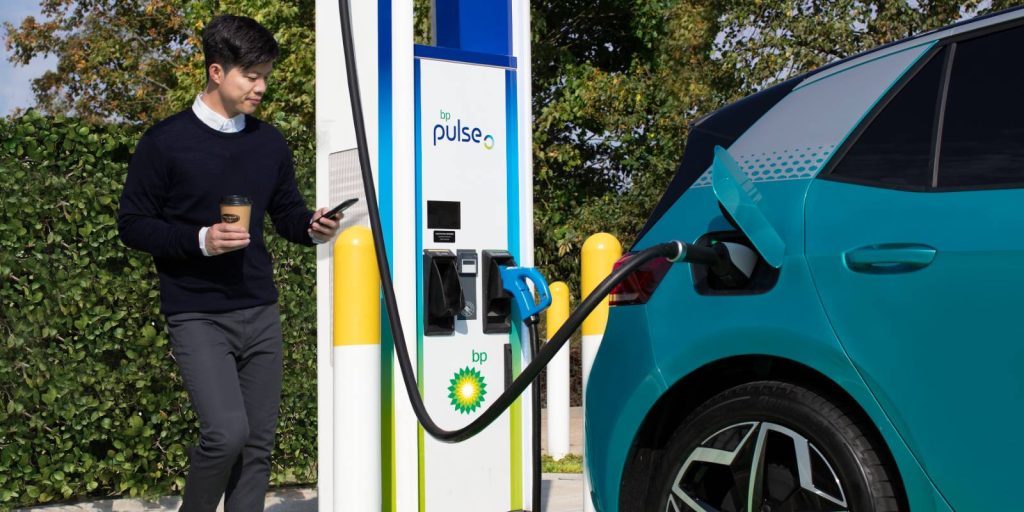
Way back in 2022, oil giant BP claimed that its BP Pulse electric vehicle chargers were “on the cusp” of being more profitable than its gas pumps. Now, three years and several technological leaps since, BP is investing billions to expand its EV charging infrastructure – and it doesn’t take a genius to realize that they’re expecting a positive ROI.
You don’t have to take my word for that, though. You can take big oil’s. “If I think about a tank of fuel versus a fast charge, we are nearing a place where the business fundamentals on the fast charge are better than they are on the (fossil) fuel,” BP head of customers and products, Emma Delaney, told Reuters.
Those fundamentals revolve around amenities. If you’re popping into a gas station for a three or four minute visit, you’re probably getting in and out as fast as you can. But if you’re there a bit longer? That’s a different story. You might visit the rest room, might buy a snack or order a coffee or suddenly remember you were supposed to pick up milk on your way home, even – and that stuff has a much higher margin for the gas station than the dino-juice, totaling 61.4% of all fuel station profits despite being a fraction of the overall revenue.
The other big winner, of course, is literally everyone. The forgotten costs of fossil fuels cost Americans billions in healthcare bills and environmental clean up each year, and untold trillions of dollars of military spending (to say nothing of the toll on three generations of American blood spilled in the Middle East to secure an affordable supply of oil).
With this plan, ICE-holes and Hemi zealots can continue to have their gas (if they decide it’s worth the wait, so be it). Meanwhile, the well-adjusted normals figure out real quick that it’s better, cheaper, and easier to charge at home.
The rest will take care of itself.
What do you guys think? Does this low-cost, high-impact idea to cut the time delta between refueling your gas car and recharging your EV have legs? What concerns do we need to address before we take it to Gavin and JB? Let us know, in the comments!
Original content from Electrek; featured image by Wikimedia user Coolcaesar, under the Creative Commons Attribution-Share Alike 3.0 Unported license.
If you’re considering going solar, it’s always a good idea to get quotes from a few installers. To make sure you find a trusted, reliable solar installer near you that offers competitive pricing, check out EnergySage, a free service that makes it easy for you to go solar. It has hundreds of pre-vetted solar installers competing for your business, ensuring you get high-quality solutions and save 20-30% compared to going it alone. Plus, it’s free to use, and you won’t get sales calls until you select an installer and share your phone number with them.
Your personalized solar quotes are easy to compare online and you’ll get access to unbiased Energy Advisors to help you every step of the way. Get started here.
FTC: We use income earning auto affiliate links. More.


Just weeks after writing about John Deere’s tried-and-true Gator side-by-side and extolling the virtues of its two-plus decades of design stasis, the engineers at Deere have launched a pair of new, li-ion Gator models that offer all-day power to move people and things all over your property in true, go-anywhere Gator fashion.
John Deere is quick to point out that these new GX side-by-side utility vehicles are not golf carts. Fair enough – while they;re not quite in the same go-anywhere league as Deere’s TH 6×4 Gas or TE 4×2 Gators, the Gator GX and GX Crew offer more than enough capability to handle just about anything you’ll find on a typical campus, golf course, or job site.
To that end, the sturdy composite dump bed, comfortable and supportive high-back foam seats seem credible enough at first glance. And, if you give the new Deere UTVs a second glance, you’ll see a 367-L (13-cu ft) cargo box can haul more than 800 lbs. (~365 kg) of mulch, nursery plantings, building supplies, firewood, animal feed, or tools.
These are serious machines, in other words, ready to get down and do some serious work, but without the noise, vibration, and harmful exhaust emissions of gas.
“The Gator GX lineup offers property owners the opportunity to increase productivity around their properties with less noise, less maintenance and more versatility,” said John Deere Go To Market Manager Eric Halfman. “These utility vehicles are intuitive and durable while offering users the comfort, reliability and convenience they expect from a John Deere Gator.”
The key component in the new GX and GX Crew is the new, 5.4 kWh, 51.2V lithium-ion battery that sends power to a high-efficiency electric drive motor with responsive torque and smooth acceleration. An onboard charger allows for convenient charging anywhere with a standard, grounded 120 outlet, eliminating the need for handling fuel or trips to the gas station and fully charging the 5.4 kWh battery over night, with more than 8 hours of continuous operation on tap that’s extendable with clever use of the new Deere’s regenerative braking.
These new electric Gators are available in classic John Deere green or grey metallic, and start at $17,499 with a whole suite of available accessories to make upfitting a breeze. The company says they’ll be available for order at your local John Deere TriGreen dealer in Q1 of 2026.
Electrek’s Take
I imagine that applying the Gator name to a vehicle that I’d call a glorified golf cart makes me feel something similar to what the Mustang guys feel whenever they see a Mach-E drive past. As such, I’ll give myself the same advice I give them: the people who make the thing decide what makes it worthy of the name, not you.
As such, I’d better get used to it. The good news there, of course, is that it seems like Deere’s latest Gator is going to be more than good enough to win me over. Eventually.
SOURCE | IMAGES: John Deere, via Charged EVs.
If you’re considering going solar, it’s always a good idea to get quotes from a few installers. To make sure you find a trusted, reliable solar installer near you that offers competitive pricing, check out EnergySage, a free service that makes it easy for you to go solar. It has hundreds of pre-vetted solar installers competing for your business, ensuring you get high-quality solutions and save 20-30% compared to going it alone. Plus, it’s free to use, and you won’t get sales calls until you select an installer and share your phone number with them.
Your personalized solar quotes are easy to compare online and you’ll get access to unbiased Energy Advisors to help you every step of the way. Get started here.
FTC: We use income earning auto affiliate links. More.
-
 Sports3 years ago
‘Storybook stuff’: Inside the night Bryce Harper sent the Phillies to the World Series
-
 Sports2 years ago
Story injured on diving stop, exits Red Sox game
-
 Sports2 years ago
Game 1 of WS least-watched in recorded history
-
 Sports3 years ago
Button battles heat exhaustion in NASCAR debut
-
 Sports3 years ago
MLB Rank 2023: Ranking baseball’s top 100 players
-
Sports4 years ago
Team Europe easily wins 4th straight Laver Cup
-
 Environment2 years ago
Japan and South Korea have a lot at stake in a free and open South China Sea
-
 Environment1 year ago
Here are the best electric bikes you can buy at every price level in October 2024