


A man who murdered four University of Idaho students in November 2022 has been sentenced to life in prison – as the mother of one of his victims expressed her disappointment that he won’t be executed.
Bryan Kohberger, a 30-year-old former criminal justice student, initially denied the killings but later pleaded guilty as part of a deal that meant he would avoid the death penalty.
Kohberger sneaked into the rented home in Moscow, Idaho, which is not far from the university campus, through a kitchen sliding door and murdered Ethan Chapin, Xana Kernodle, Madison Mogen and Kaylee Goncalves.
Bryan Kohberger in court, and his victims Kaylee Goncalves, Maddie Mogen and Xana Kernodle, and Xana’s boyfriend Ethan Chapin. Pic: AP
Kohberger has never revealed his motive and it is not clear why he spared two roommates who were in the home.
Post-mortem examinations showed the four who died were stabbed multiple times and were likely asleep when they were attacked – with some sustaining defensive wounds.
Kohberger was arrested at his parents’ home in Pennsylvania weeks after the killings following a nationwide search.
Judge Steven Hippler sentenced Kohberger to four life sentences without parole for four counts of first-degree murder today.

Kaylee Goncalves (bottom left), Maddie Mogen (top left) and Xana Kernodle, and Xana’s boyfriend Ethan Chapin
A ‘delusional, pathetic, hypochondriac loser’
Family members of the victims gave statements in court today ahead of the sentencing – with the murderer’s mother Maryann Kohberger in attendance for the hearing.
Ms Kohberger quietly wept at times as the other parents described their grief.
Ms Goncalves’ mother Kristi Goncalves said she was disappointed that Kohberger won’t be executed by firing squad but revelled in how he would suffer in prison.
“You will always be remembered as a loser, an absolute failure,” she said.
“Hell will be waiting,” she added.

Kristi Goncalves at a hearing earlier this month. Pic: AP
Alivea Goncalves, the victim’s sister, drew applause after belittling Kohberger, who remained expressionless as she insulted him.
“You didn’t win, you just exposed yourself as the coward you are,” she said. “You’re a delusional, pathetic, hypochondriac loser.”
Steve Goncalves, the victim’s father, spoke to Kohberger directly and said: “Today we are here to finish what you started.”
Kohberger nodded subtly in response.

Alivea Goncalves speaks during the sentencing hearing. Pic: AP
Mr Goncalves added: “You tried to break our community apart, you tried to plant fear, you tried to divide us. You failed.”
In a statement read on her behalf by her lawyer, Ms Mogen’s mother Karen Laramie said: “Any one of us would have given our own life to have been outshone by hers.”
Ms Mogens’ mother declined to address Kohberger directly, as he remained expressionless, but closed her statement by saying the family might never forgive him or “ask for mercy” for what he did.
“His acts are too heinous,” her statement read.

Karen and Scott Laramie, the mother and stepfather of Madison Mogen, outside court. Pic: AP
Bethany Funke, who survived the attack, said about her roommates in a statement to the court: “I hated and still hate that they are gone, but for some reason, I am still here and I got to live. I still think about this every day. Why me? Why did I get to live, and not them?”
She described one of the victims, Ms Kernodle, as “one in a million. She was the life of the party”.
Much of her statement was devoted to remembering her four close friends who died – recounting the nights they spent binge-watching reality television, making dinner together, going to parties at their university and the love that they had for each other.
Her testimony reduced many at the hearing to tears.

Bryan Kohberger. Pic: Reuters
Dylan Mortensen, the second surviving roommate, said in court that she has panic attacks that force her to relive the trauma of what she experienced.
She said: “I was too terrified to close my eyes, terrified that if I blinked, someone might be there. I made escape plans everywhere I went… “He may have shattered parts of me but I’m still putting myself back together piece by piece,”
Kohberger’s head bobbed slightly as she spoke.


Two children and a woman have died in a shooting in County Fermanagh, police have said.
Two people were killed in the shooting on Wednesday morning, and a third, who was seriously injured, died in hospital in the afternoon.
A fourth person, a man, was seriously injured in the shooting in County Fermanagh, Northern Ireland.
All victims were from the same household, Superintendent Robert McGowan, district commander for Fermanagh and Omagh, said at a news conference.
Police have cordoned off the scene in the village of Maguiresbridge, about 75 miles (120km) southwest of Belfast.
“We can advise there is no ongoing risk to the public,” a Police Service of Northern Ireland spokesperson said.
There was no mention of a motive behind the shooting.
The scene in the Drummeer Road area of Maguiresbridge, Co Fermanagh. Pic: Oliver McVeigh /PA Wir
A murder investigation has been launched, with enquiries being at an early stage.
Supt McGowan said at the news conference that police don’t anticipate any arrests being made at this stage.
Emergency services were called to the Drummeer Road area of the village at around 8am on Wednesday following a report raised from the property, Supt McGowan said.
Two people were found dead at the scene, and two others seriously injured.

One patient was taken to the Royal Victoria Hospital, Belfast, by air ambulance and the other to South West Acute Hospital by ambulance. Supt McGowan said the third person died at the South West Acute Hospital.
Drummeer Road is currently closed, police said, warning that this could lead to delays on alternative roads.

Drummeer Road has been cordoned off. Pic: Oliver McVeigh /PA Wir
Secretary of State for Northern Ireland Hilary Benn said: “The news from Maguiresbridge is tragic and deeply distressing.
“My thoughts are with the victims, their relatives and the local community in Fermanagh. I would urge the public not to speculate and to allow the PSNI to continue their investigation.”
Sinn Fein MP Pat Cullen has expressed her deep shock over the shooting, saying: “Firstly, my thoughts are with the victims and their families at this tragic time.”
Read more from Sky News:
Jailed traders’ convictions overturned
Family tribute after death of teenager
DUP MLA Deborah Erskine, who represents the area in the Northern Ireland Assembly, said that the community was “stunned” by the shooting in “a rural, quiet area”.
“Everyone is deeply affected by what has happened this morning,” she said.

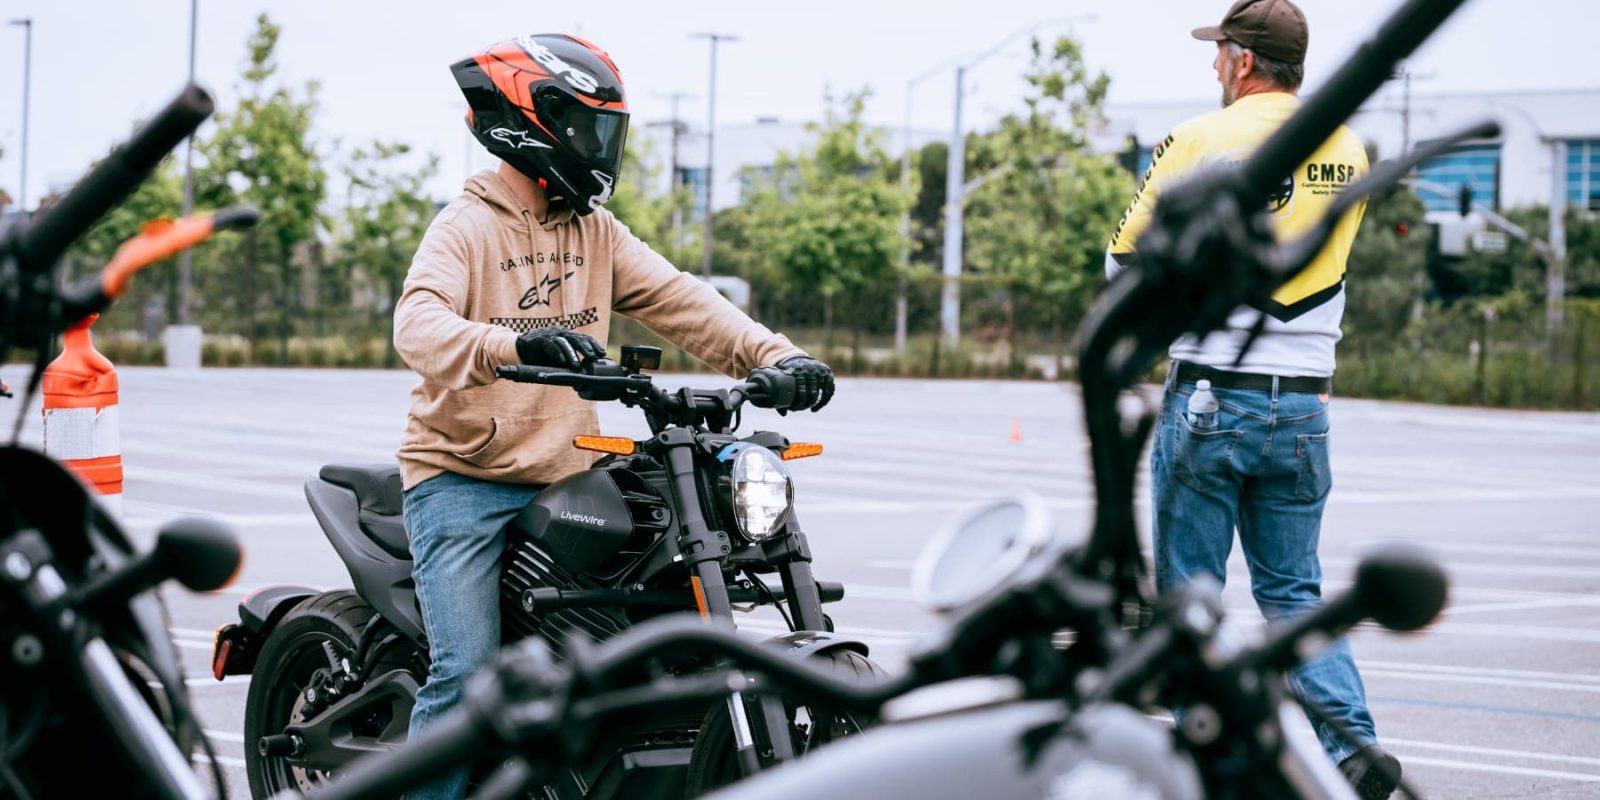
Getting a motorcycle license just got a little easier – and more electrifying. In a move that could help usher more riders into the electric future, new riders now have a chance to learn on LiveWire electric motorcycles as part of a licensing course.
It’s all starting at Bartels’ Harley-Davidson Riding Academy in Marina del Rey, where new riders preparing for the Motorcycle Safety Foundation (MSF) riding course can now opt for a LiveWire electric motorcycle instead of the standard internal combustion engine (ICE) motorcycle learner bikes.
The Riding Academy is now integrating the LiveWire S2 Mulholland and the S2 Alpinista into its official training fleet for its MSF-based rider course, making it one of the first in the country to use electric motorcycles for license training. Aspiring motorcyclists can now learn to ride on a smooth, quiet, clutch-free electric machine instead of the gasoline-powered bikes typically used in beginner courses.
Without the need to learn and master concepts such as clutch friction zones and shifting, riders can dedicate more focus to the riding principles that form the foundation of safe motorcycling.
New riders learn those skills associated with safe motorcycle riding alongside instructors certified by the California Motorcyclist Safety Program (CMSP) and the Harley-Davidson Riding Academy. Graduates of the course earn their DL389 and Riding Academy Certificate of Completion. That leaves riders just one written exam passing score away from receiving their motorcycle endorsement.
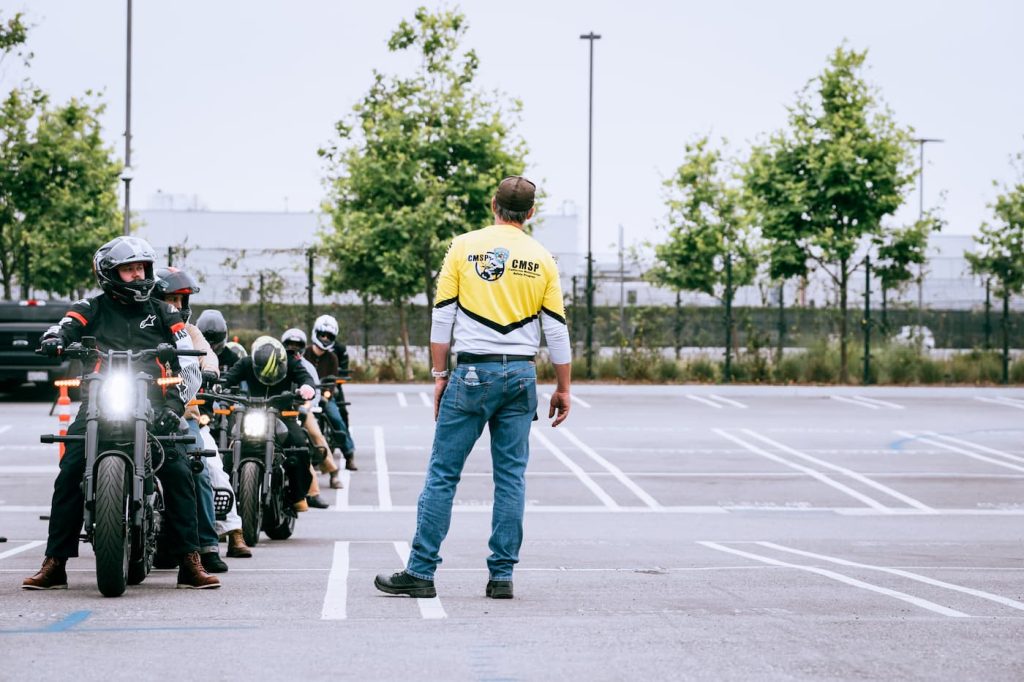
Greg Andrews is the Riding Academy Site Manager at Bartels’ Harley-Davidson, and he explained that adding the LiveWire electric motorcycle into the rider course fundamentally shifted how students were able to learn.
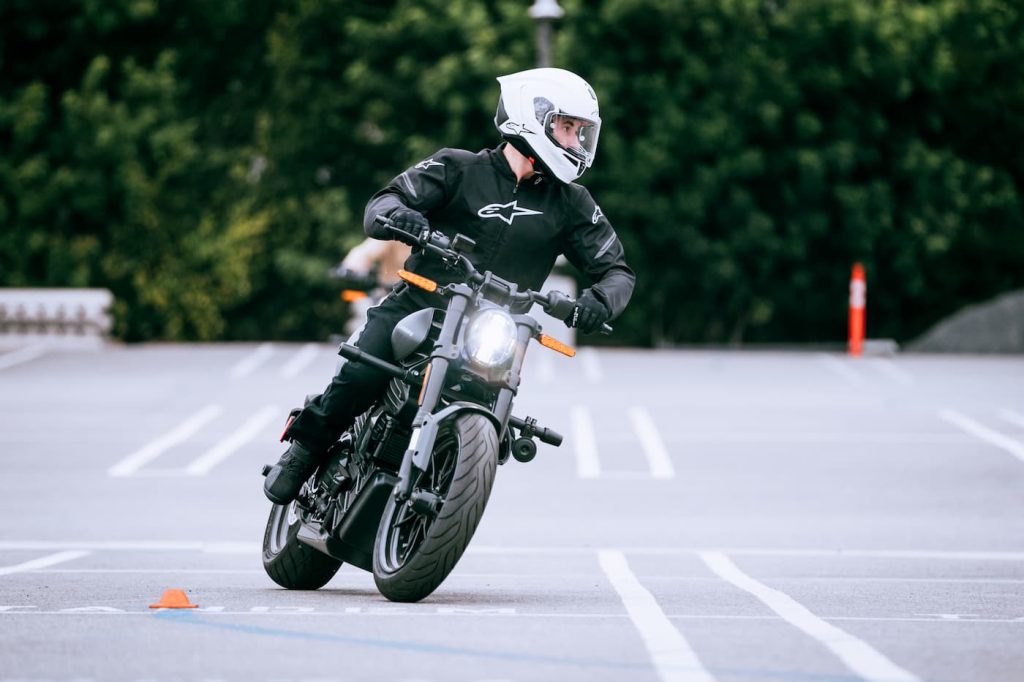
“What the LiveWire does, as a basic trainer, is to allow the student to focus strictly on core riding skills,” said Andrews. He added that the XG500 and RA350 ICE motorcycles normally used in the course are good bikes in their own right, but they aren’t ideal for training new riders on important handling skills because of the added distraction in having to first learn and become proficient in operating a clutch and shifting while mastering throttle control.
“Students who have no idea of the science of leaning, corner traction percentages, gained and lost to lean angle, etc., are distracted by the ICE powertrain, versus the LiveWire students, whose sole focus is riding essentials,” said Andrews. “As a pilot, my father had me learn initially in gliders. There I learned pitch, roll, and yaw, coordinated turning, etc., and all the things necessary to fly larger aircraft. I’ve flown 60 different aircraft since. The LiveWire is essentially the glider.”

Members from Alpinestars’ graphics team were among the first to participate in the inaugural electric option for the rider training course.
“The repetition of stop-and-go made me appreciate eliminating clutch and shifting. It was also much easier to navigate tight turns and cone swerving,” said course graduate Tyler Emond, who completed the rider training on a LiveWire S2 electric motorcycle. “I think from a beginner standpoint, electric is 100% the way to start out.”
It was a sentiment shared by many, even those who already had experience with manual transmission vehicles. “I already know the basics of shifting because I’ve ridden dirt bikes and I drive a manual transmission car,” said fellow course graduate Dillon Kinkead. “And I think that being able to work on operating a motorcycle without having to focus on shifting is a benefit because I was able to concentrate on accelerating, braking, and turning.”
Bartels’ Harley-Davidson Rider Academy is now taking enrollment for more classes featuring the LiveWire S2 learner bikes, and interested riders can sign up online. LiveWire plans to expand electric rider training across the country, making riding more accessible and less intimidating for new generations.
Electrek’s Take
I have been calling for this for years and I’m super excited to finally see it become a possibility.
To be honest, I often saw it merely as cutting out an unnecessary step of learning something that would likely never be used (i.e., shifting gears on a motorcycle). Electric learner bikes didn’t used to be an issue because most electric motorcycle riders were converts from ICE bikes, having made the switch after seeing the light. But with more people than ever getting into electric motorcycles without ever having ridden a gasoline-powered motorcycle, it made sense to me that learning to work a clutch on a gas bike was wasted effort in such a case.
But I never really thought about how much more quickly it would allow someone to actually leapfrog the skills-based learning. And that makes perfect sense. Why spend several hours crawling across a parking lot while discussing the “friction zone” when you could already be learning about countersteering, lean angles, and evasive maneuvers?
And if I can speak from personal experience for a moment, this hits home for me as someone who actually went through a Harley-Davidson Rider Academy course to get my motorcycle license. In fact, I’ve gone through licensing courses in two countries, once on a Harley-Davidson Street 500 and once on a Kawasaki Ninja 400. I drove a 40-year-old manual transmission car every day in high school, and so learning to shift on a motorcycle came quickly, but few people come from that background anymore. I saw plenty of people struggle to learn to shift when they should have been learning to ride. And since plenty of folks like me see themselves in an electric motorcycle future, that extra time and frustration spent learning muscle memory only relevant to a gasoline-powered bike is wasted.
For those that do plan to go back to ICE, I can definitely see the value here too. You master the riding skills first, then you can spend all the time you need to learn to shift smoothly. But trying to learn to ride when you only learned how to get into first gear an hour ago is a recipe for frustration.
So, short story short, I’m all about this. With a whole generation of young riders now getting into motorcycles thanks to years of riding electric bikes, I imagine there will be many more takers for these types of all-electric training programs in the coming years.
FTC: We use income earning auto affiliate links. More.
-
 Sports3 years ago
‘Storybook stuff’: Inside the night Bryce Harper sent the Phillies to the World Series
-
 Sports1 year ago
Story injured on diving stop, exits Red Sox game
-
 Sports2 years ago
Game 1 of WS least-watched in recorded history
-
 Sports2 years ago
MLB Rank 2023: Ranking baseball’s top 100 players
-
Sports4 years ago
Team Europe easily wins 4th straight Laver Cup
-
 Sports2 years ago
Button battles heat exhaustion in NASCAR debut
-
 Environment2 years ago
Japan and South Korea have a lot at stake in a free and open South China Sea
-
 Environment2 years ago
Game-changing Lectric XPedition launched as affordable electric cargo bike