

Renewables now make up 30% of US power capacity – FERC
Renewables – solar, wind, biomass, geothermal, hydropower – are now 30% of total US electrical generating capacity, according to analysis of FERC’s mid-year data.
The Federal Energy Regulatory Commission (FERC)’s latest monthly “Energy Infrastructure Update” (with data through June 30, 2024), which was reviewed by the SUN DAY Campaign, also reported that June was the 10th month in a row in which solar was the largest source of new capacity. That puts solar on track to become the US’s second-largest source of capacity – behind only natural gas – within three years.
FERC says renewables were 99% of new generating capacity in June and 91% in H1 2024. 37 “units” of solar totaling 2,192 megawatts (MW) were placed into service in June along with one unit of hydropower (34 MW). Combined, they accounted for 98.9% of all new generating capacity added during the month. Natural gas and oil provided the balance: 20 MW and 5 MW, respectively. (Generating capacity is not the same as actual generation.)
During the first half of 2024, solar and wind added 13,072 MW and 2,129 MW, respectively. Combined with 212 MW of hydropower and 3 MW of biomass, renewables were 91.2% of capacity added. The balance consisted of the 1,100 Vogtle-4 nuclear reactor in Georgia plus 369 MW of gas, 11-MW of oil, and 3-MW of “other.”
Solar was 97% of new capacity in June and 77% during H1 2024. The new solar capacity added in the first half of 2024 was more than double the solar capacity (6,446 MW) added year-over-year. Solar accounted for 77.4% of all new generation placed into service in the first half of 2024.
New wind capacity in the same period accounted for most of the balance – 12.6% – which was slightly less than that added year-over-year (2,761 MW).
In June alone, solar comprised 97.4% of all new capacity added, followed by hydropower (1.5%). Solar has now been the largest source of new generating capacity for ten months straight: September 2023 – June 2024. For seven of those 10 months, wind took second place.
Solar plus wind are now more than a one-fifth of US generating capacity. The combined capacities of just solar and wind now constitute more than 20.7% of the US’s total available installed utility-scale generating capacity.
However, a third or more of US solar capacity is in the form of small-scale (e.g., rooftop) systems that isn’t reflected in FERC’s renewables data. Including that additional solar capacity would bring the share provided by solar + wind closer to a quarter of the US’s total.
Solar’s share of US generating capacity advances it to fourth place. The latest capacity additions have brought solar’s share of total available installed utility-scale (that is, >1 MW) generating capacity up to 9%, further expanding its lead over hydropower (7.8%). Wind is currently at 11.8%. With the inclusion of biomass (1.1%) and geothermal (0.3%), renewables now claim a 30% share of total US utility-scale generating capacity.
Installed utility-scale solar has now moved into fourth place – behind natural gas (43.3%), coal (15.8%), and wind – for its share of generating capacity after having recently surpassed that of nuclear power (8%).
Solar will soon become the second largest source of US generating capacity. FERC reports that net “high probability” additions of solar between July 2024 and June 2027 total 88,526 MW – an amount almost four times the forecast net “high probability” additions for wind (23,851 MW), the second fastest growing resource.
FERC also foresees growth for hydropower (1,240 MW), geothermal (400 MW), and biomass (90 MW). There’s no new nuclear capacity in FERC’s three-year forecast, and coal, natural gas, and oil are projected to contract by 20,542 MW, 3,106 MW, and 1,629 MW, respectively.
If FERC’s current “high probability” additions materialize, by July 1, 2027, solar will account for more than one-seventh (14.8%) of the nation’s installed utility-scale generating capacity. That would be greater than either coal (13.3%) or wind (12.7%), and substantially more than either nuclear power (7.5%) or hydropower (7.4%). That means the installed capacity of utility-scale solar would move into the No. 2 spot behind natural gas (40.3%).
Meanwhile, the mix of all renewables would account for 36.3% of total available installed utility-scale generating capacity – rapidly approaching that of natural gas – with solar and wind constituting more than three-quarters of the installed renewable energy capacity.
If small-scale solar systems are taken into account, within three years, total US solar capacity is likely to approach – and very possibly surpass – 300 GW. In turn, the mix of all renewables would then exceed 40% of total installed capacity, while the share of natural gas share would drop to about 37%.
Ken Bossong, the executive director of nonprofit research and educational organization SUN DAY Campaign, said:
With each passing month, renewables – led by solar – expand their contribution to the nation’s electrical capacity.
Growing from just a fraction of one percent a decade ago, solar is now nearly a tenth of US utility-scale generating capacity and poised to reach 15% within three years.
Read more: US power grid boosts capacity by 20.2 GW in the first half of 2024
To limit power outages and make your home more resilient, consider going solar with a battery storage system. In order to find a trusted, reliable solar installer near you that offers competitive pricing, check out EnergySage, a free service that makes it easy for you to go solar. They have hundreds of pre-vetted solar installers competing for your business, ensuring you get high-quality solutions and save 20-30% compared to going it alone. Plus, it’s free to use and you won’t get sales calls until you select an installer and you share your phone number with them.
Your personalized solar quotes are easy to compare online and you’ll get access to unbiased Energy Advisers to help you every step of the way. Get started here. –trusted affiliate link*
FTC: We use income earning auto affiliate links. More.


In a record-setting deal worth billions, Chinese heavy equipment manufacturer XCMG has agreed to deliver more than 200 of its 240-tonne electric haul trucks to Australian mining giants Fortescue in one of the biggest moves yet to decarbonize mining.
From pioneering its “world’s first” best-practice model for smart mining at China Huaneng’s Yimin Mine and winning the 2025 Decarbonizing Mining Award to ranking among the world’s top four open-pit heavy equipment makers, XCMG is rapidly building a reputation for building high-quality electric equipment options that can do all the work without any of the emissions.
Earlier this week, XCMG joined Fortescue, one of the world’s largest iron ore producers, at a grand signing ceremony in Beijing for a strategic cooperation agreement on green mining equipment solutions. Under the terms of the new deal, XCMG will deliver up to 200 of its massive, 240T battery-electric haul trucks to Fortescue, beating a similar deal posted last year and marking China’s largest-ever export order for green mining machinery.
It’s also one of the largest-ever EV sales, period.
Big deal

Fortescue believes the deal isn’t just significant for its size and scope, but for building new global bridges in the quest for full decarbonization.
“The world once benefited from open trade and cooperation – now it is divided,” explains Fortescue Executive Chairman and Founder, Dr. Andrew Forrest. “Fortescue is showing that industry can help glue back that multilateral spirit. Not through rhetoric, but through practical alliances that prove heavy industry can follow a new path – one where profits rise as emissions fall.”
“China is scaling and manufacturing green technologies at unprecedented speed,” adds Forrest. “and “Our partnerships give Fortescue access to that capability.”
As for the trucks themselves, the new XCMG 240T electric haul trucks are absolute giants, built to handle payloads over 500,000 lbs., with a gross vehicle weight rating somewhat north of 380 (!) tonnes (that’s almost 420 Imperial tons, to you and me).
There’s enough power on tap from the big haul trucks’ 1,900 kW (2,550 hp) electric drive system to climb 17% grades and hit speeds up to 56 km/h (35 mph). That’s enough to make XCMG’s 240T one of the most powerful and capable EVs on the planet, slashing emissions without sacrificing hauling performance.
With Fortescue already saving hundreds of millions in fuel costs, this deal – big as it – is going to put an absolutely massive dent in global diesel demand.
SOURCES: Fortescue, Yahoo! Finance.

If you’re considering going solar, it’s always a good idea to get quotes from a few installers. To make sure you find a trusted, reliable solar installer near you that offers competitive pricing, check out EnergySage, a free service that makes it easy for you to go solar. It has hundreds of pre-vetted solar installers competing for your business, ensuring you get high-quality solutions and save 20-30% compared to going it alone. Plus, it’s free to use, and you won’t get sales calls until you select an installer and share your phone number with them.
Your personalized solar quotes are easy to compare online and you’ll get access to unbiased Energy Advisors to help you every step of the way. Get started here.
FTC: We use income earning auto affiliate links. More.
![The Puckipuppy Labrador Pro is a full-suspension E-bike for everyone [Video]](https://i0.wp.com/electrek.co/wp-content/uploads/sites/3/2025/09/puckipuppy-header.jpg?resize=1200,628&quality=82&strip=all&ssl=1)
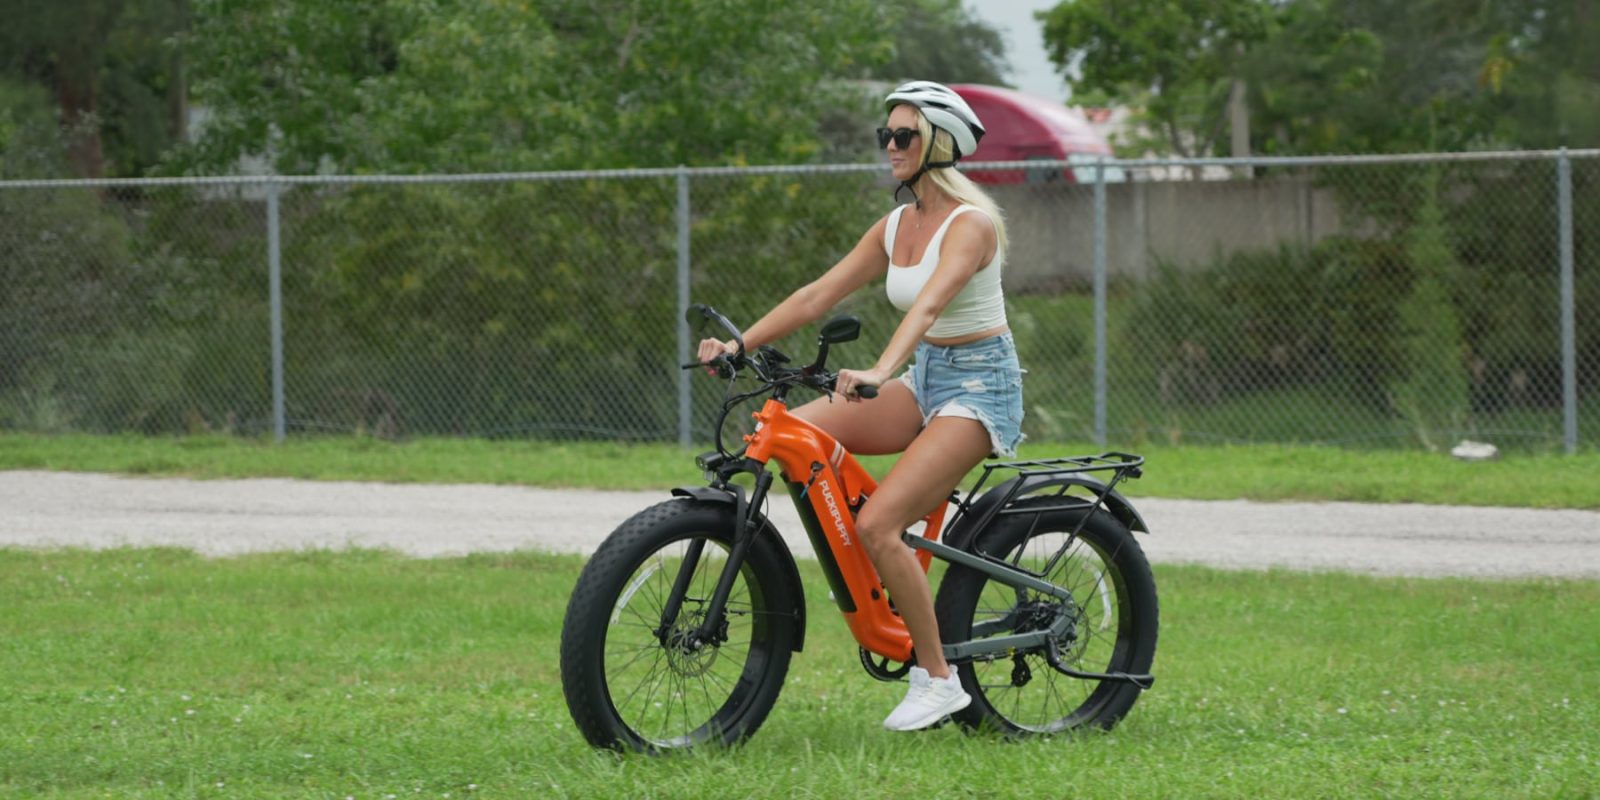
There are plenty of electric fat tire bikes on the market these days, but few feel as purpose-built and refined as the Puckipuppy Labrador Pro. While the name might sound like a friendly pooch, don’t let it fool you… this is a serious all-terrain machine with enough power to rip through sand, snow, or steep trails. Plus, if it can do all that, it can surely handle your commute, too!
Built for the wild (and the wild commute)
Right out of the gate, the Puckipuppy Labrador Pro feels like it’s aimed at a very specific type of rider – someone who wants the capability of an electric mountain bike, the stability of a fat tire cruiser, and the commuting chops of a Class 3 bike built for the streets.
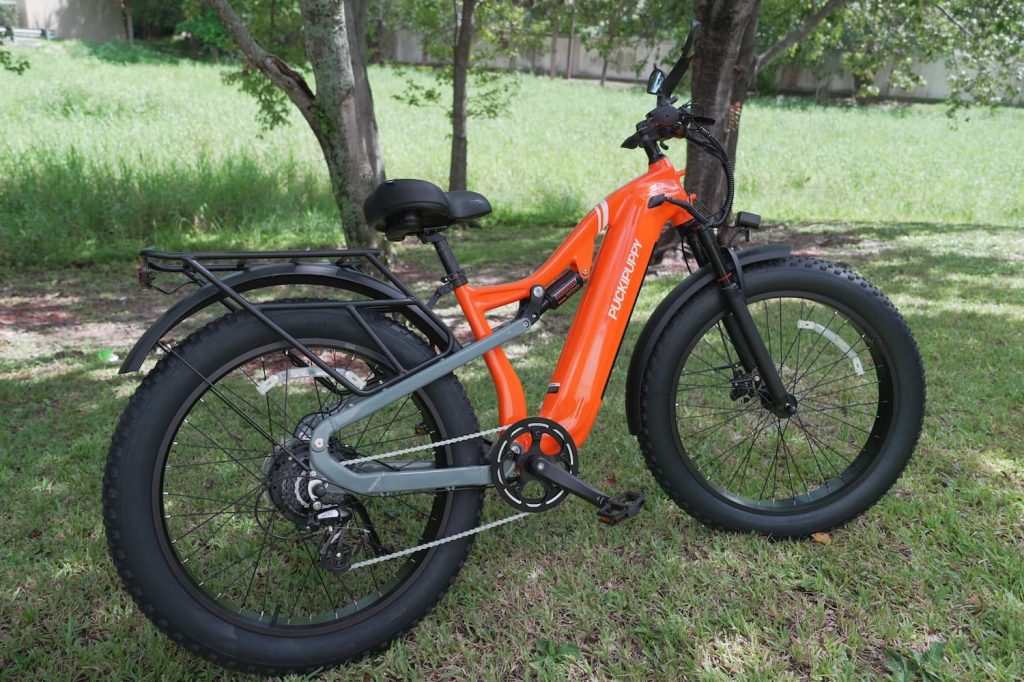
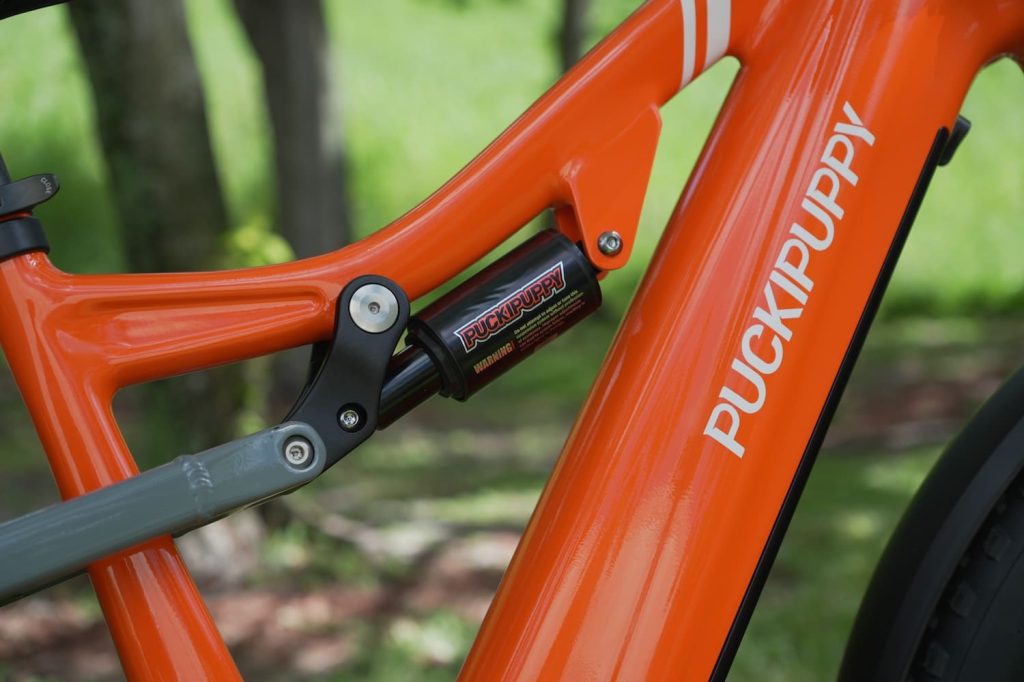
That hybrid identity is reflected in the bike’s rugged 6061 aluminum frame, which includes internal cable routing for a clean look and a removable 48V 20Ah lithium-ion battery nestled into the downtube. The battery is locking and removable, offering a massive 960Wh of capacity. It claims up to 80 miles of range per charge under optimal conditions.
That’s quite respectable for a nearly 1 kWh battery powering a peak 1,350W hub motor!
Custom-motor muscle with real torque
Puckipuppy’s Labrador Pro isn’t running just any hub motor. This one’s a custom PUCKIPUPPY-branded unit, and it cranks out a claimed 1,350W of peak power. In addition to an extra helping of wattage, this thing delivers serious torque, and it delivers it instantly.
Thanks to the smart torque sensor, the motor responds immediately to how hard you’re pedaling. You don’t get that jarring “kick” from cadence-sensor bikes. Instead, the assist feels intuitive and fluid, even when climbing steep dirt paths or rolling over beach dunes.
It’s the kind of responsive pedaling experience that makes you forget you’re even riding an electric bike, at least until you realize you’re doing a solid 25 mph while barely breaking a sweat.
Suspension and traction dialed in
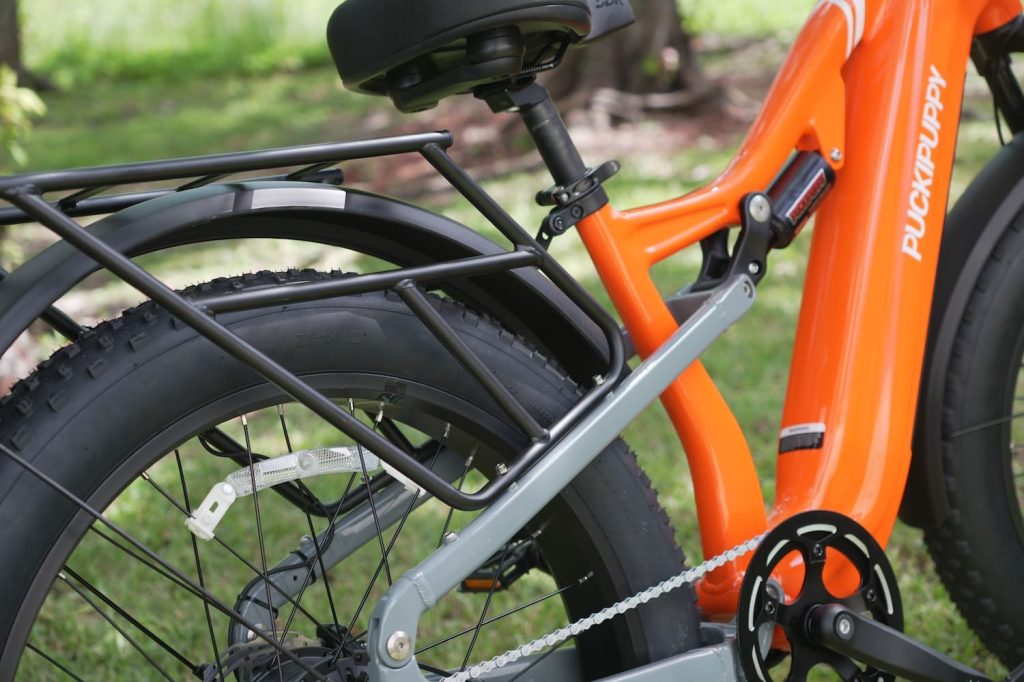
One of the standout features of the Labrador Pro is its full-suspension setup, which instantly sets it apart from most fat tire e-bikes in this price range. Up front, you’ve got a sturdy hydraulic suspension fork with 130mm of travel, while the rear features its own shock that smooths out bumps, roots, and rough terrain. Whether rolling over rocky trails or dropping curbs in the city, the dual suspension keeps the ride comfortable and under control.
That plush suspension pairs perfectly with the bike’s 26” x 4” all-terrain fat tires, which offer a massive contact patch and plenty of cushion. The bike can float over sand, gravel, and even loose pine-needle trails with zero drama. These tires aren’t limited to only off-road performance either. On pavement, they give the Labrador Pro a smooth, stable feel, especially when aired up to road pressure.
And when it comes time to slow things down, the 180mm hydraulic disc brakes give you reliable, confidence-inspiring stopping power, even on fast descents or in wet conditions.

Drivetrain and speed
Backing up the torque-heavy motor is a Shimano 8-speed drivetrain, which shifts smoothly and gives you enough range to ride comfortably even without assist. That’s especially nice when your battery gets low, or when you want to dial down the motor to extend your range on a long ride.
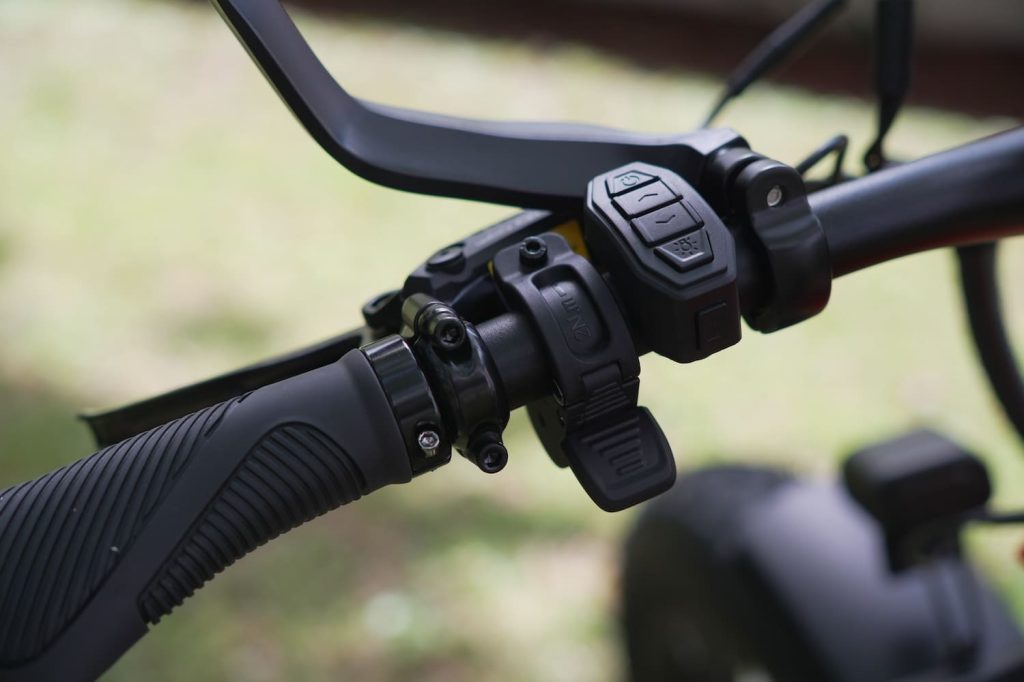
The Labrador Pro is also a Class 3 e-bike, meaning it provides pedal assist up to 28 mph. There’s also a left-side thumb throttle that can get you moving without pedaling at all, and it’s zippy – topping out around 20 mph on throttle alone. Combined, these modes make the Labrador Pro equally useful as a car-replacing commuter or a weekend trail shredder.
Looks and utility of the Puckipuppy Labrador Pro
The Puckipuppy Labrador Pro comes in four different colors, though the orange option here is definitely the brightest and the most fun, at least in our opinion. No matter your color, the integrated headlight and rear brake light are a nice touch for safety to help you be seen, especially for early morning or dusk rides.
It also includes front and rear fenders, which help when you’re splashing through mud or wet pavement, and a heavy-duty rear cargo rack. Plus, the bike supports up to 400 lb of payload. That makes this bike more than just a toy – it’s also a workhorse capable of hauling groceries, gear, or just about anything you can throw at it.
The full-color LCD display mounted on the handlebars gives you real-time readouts of speed, battery level, distance, and assist level. The control pad on the left is intuitive, and gives you all the info you need at a glance.
Final thoughts on the Puckipuppy Labrador Pro
The Puckipuppy Labrador Pro is a seriously capable all-terrain e-bike with great specs at a competitive price of just $1,599. For riders who want a go-anywhere, do-anything machine with torque-sensing pedal assist, fat tires, and real power under the hood, this is a compelling option.
It’s not the cheapest fat tire e-bike out there, but you don’t want the cheapest bike when you’re barrelling down a rocky trail. And when you consider the powerful motor, torque sensor, 960Wh battery, hydraulic brakes, and full commuter-ready features like fenders and a rack, it starts to look like a solid value.
Whether you’re carving through mountain trails, powering across sandy beaches, or just blasting past traffic on your way to work, the Labrador Pro brings its A game every time.
FTC: We use income earning auto affiliate links. More.

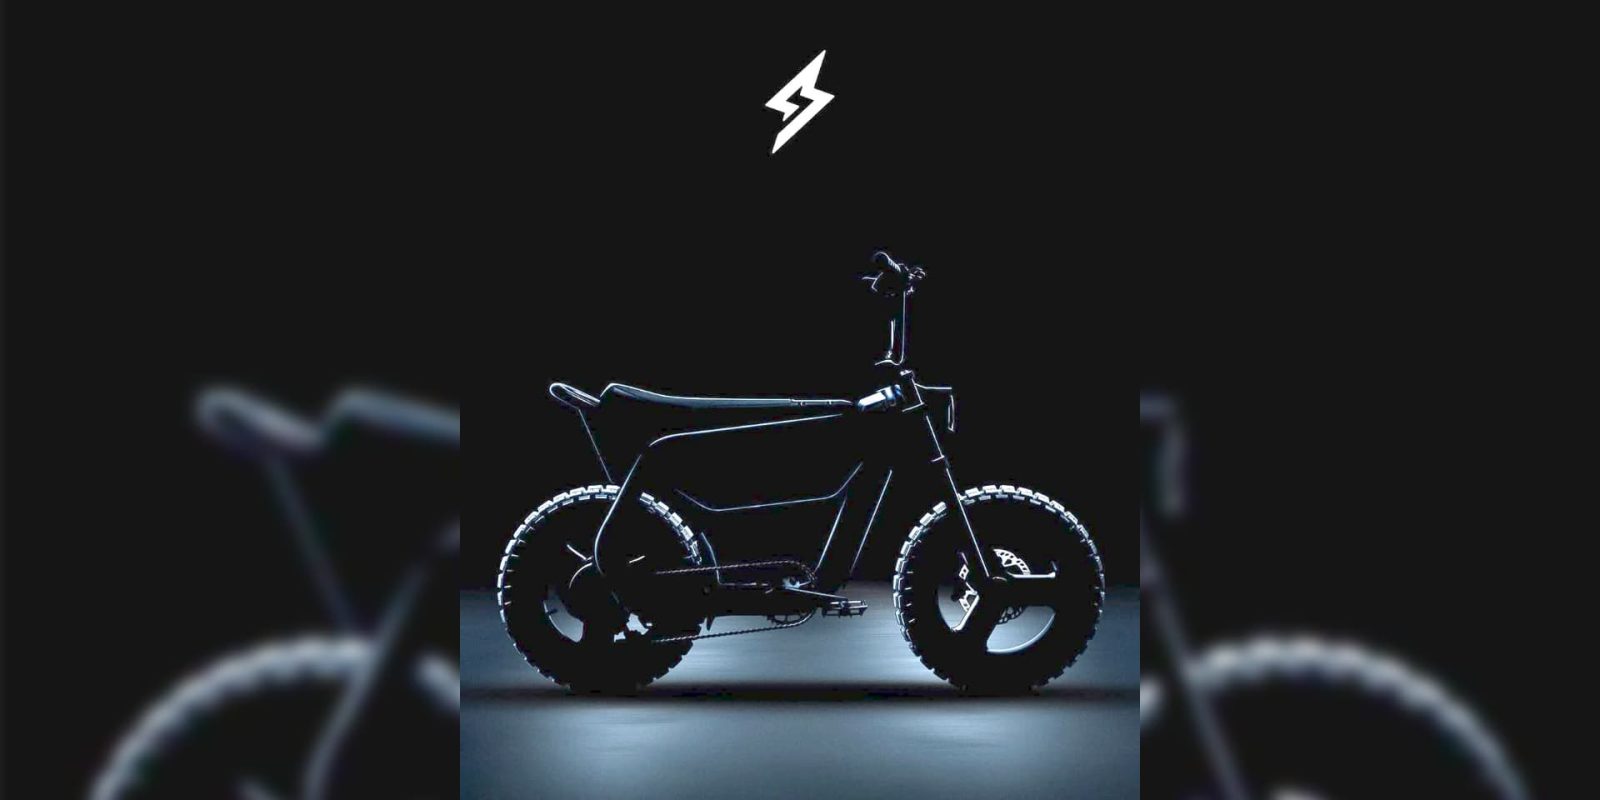
Super73, the lifestyle e-bike brand known for its moto-inspired designs, just dropped a teaser that has fans buzzing… and scratching their heads. In a cryptic Instagram post, the company shared a silhouetted image of a new two-wheeled electric vehicle alongside the promise of unveiling “an entirely new generation of electric mobility” next month.
The official debut is set for October 11th at the Moto Beach Classic, and while details are scarce, the image and language give us a few key clues.
First, there are the visuals. The teaser image shows a chunky, fat-tire two-wheeler that looks like a departure from Super73’s current lineup. The frame appears heavily stylized with what may be body panels that cover part of the traditional bike silhouette in the rear, or perhaps just extra gussets on the frame. There’s no visible suspension, neither in the fork nor the rear triangle (in fact, there’s no rear triangle at all, opting for a classic mini-bike styled frame instead), suggesting this could be a rigid ride. That could point to a lightweight design or a retro mini-bike platform that ditches extra components in favor of simplicity and affordability.
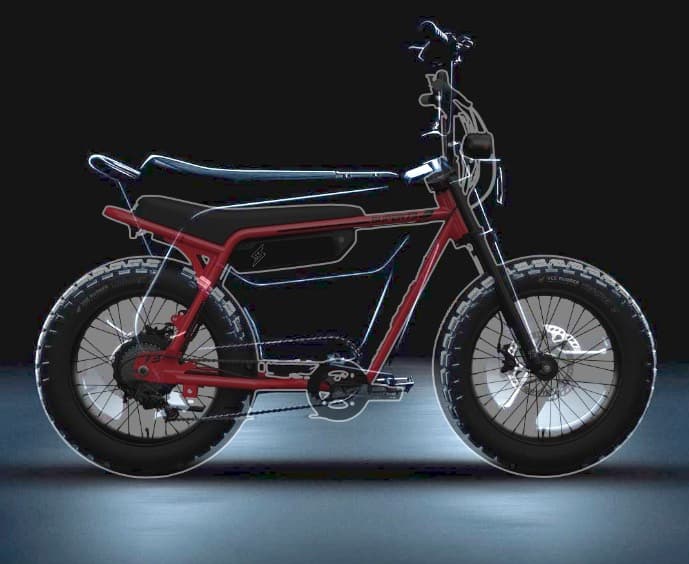
Pedals are still visible, keeping this squarely in e-bike territory (at least legally), but everything else about the bike leans much more toward electric moto than bicycle. With large off-road tires, a long flat seat, and a minimalist-looking cockpit, it gives off stripped-down dirt bike or electric pit bike vibes.
There’s also a fairly large battery slung under the top tube. If the bike rides on 20″ tires like the rest of Super73’s lineup, then that could be a much bigger battery than we’re used to seeing. I overlaid a Super73-Z Miami on the image below, and you can see that the mystery bike’s battery dwarfs the one on the red Super73-Z. But those could also be smaller-diameter tires, meaning the battery may be a standard Super73 pack.
Then there’s the caption. Super73 says they’re unveiling the “next big thing (figuratively speaking),” which might lend credence to the theory that this will actually be smaller than their usual offerings. Could it be a compact adventure mini-bike? A budget-friendly urban ripper? A youth-focused model? We’ve seen the brand expand into kids’ bikes before, so it wouldn’t be a shocker.
The real wildcard is how much power this thing will pack. Super73 has always leaned into the blurred line between e-bike and moped, and if this new model keeps pedals just for show while cranking serious wattage under the hood, we might be looking at something more akin to a Sur Ron competitor.
With recent shakeups in Super73’s leadership team and the seemingly frozen state of the long-awaited Super73’s C1X electric motorcycle, which only made it partway through development, perhaps this could be the new model replacing the company’s former motorcycle aspirations.
Whatever it is, it’s not just another iteration of the RX. This looks like a whole new category, possibly even a new platform for the brand. And in an industry where yearly innovation often just means a new paint job, it’s refreshing to see a company hint at something different.
Stay tuned – we’ll be watching closely when the curtain lifts next month.
FTC: We use income earning auto affiliate links. More.
-
 Sports3 years ago
‘Storybook stuff’: Inside the night Bryce Harper sent the Phillies to the World Series
-
 Sports1 year ago
Story injured on diving stop, exits Red Sox game
-
 Sports2 years ago
Game 1 of WS least-watched in recorded history
-
 Sports3 years ago
Button battles heat exhaustion in NASCAR debut
-
 Sports3 years ago
MLB Rank 2023: Ranking baseball’s top 100 players
-
Sports4 years ago
Team Europe easily wins 4th straight Laver Cup
-
 Environment2 years ago
Japan and South Korea have a lot at stake in a free and open South China Sea
-
 Environment12 months ago
Here are the best electric bikes you can buy at every price level in October 2024