

US solar and wind growth defies expectations – a decade in numbers

The latest US EIA and FERC data reflect a decade of explosive solar and wind growth – here’s how it breaks down.
The SUN DAY Campaign reviewed EIA’s latest monthly “Electric Power Monthly” report (with electrical generation data through June 30, 2024) and compared it to EIA’s data for June 30, 2019 and for June 30, 2014. It also examined FERC’s latest monthly “Energy Infrastructure Update” report (with installed generating capacity data through June 30, 2024) and likewise compared it to FERC’s data for June 30, 2019 and for June 30, 2014.
The installed US generating capacity mix of all renewable energy sources (i.e., biomass, geothermal, hydropower, solar, and wind) now totals 389 gigawatts (GW). That’s over 50% greater than five years ago (258.58 GW) and more than double the renewable energy capacity that existed a decade ago (190.26 GW). Most of the growth is because of new solar and wind capacity.
Similarly, electrical generation by renewables has shown strong growth. Ten years ago, renewables provided 14.28% of the nation’s electrical generation. Five years later, it had grown to 20.11% and today stands at 26.01%. Again, most of the increase is due to wind and solar.
For the first half of 2024, renewables, including small-scale solar, provided 549,339 gigawatt-hours (GWh) of electrical generation. That’s almost 40% more than the amount renewables generated in the first half of 2019 (399,586 GWh) and nearly double the output reported for the first half of 2014 (287,136 GWh).
Over the past decade, wind has become a leader
Ten years ago, hydropower boasted about 62% more capacity than wind (99.64 GW vs. 61.45 GW) and generated 40% more electricity (140,659 GWh vs. 99,739 GWh).
Five years later, the two were nearly equal in both capacity (hydro: 100.73 GW vs. wind: 98.86 GW) and electrical generation (hydro: 153,790 GWh vs. wind: 154,338 GWh).
Now, however, wind has definitively overtaken hydropower with 152.64 GW of installed capacity compared to that of hydro (100.88 GW) as well as 247,435 GWh of actual electrical output during the first six months of 2024 compared to 126,139 GWh from hydro.
As of mid-2024, wind accounted for 11.72% of total US electrical generation. Five years prior, it was 7.77%, and a decade ago, its share (4.96%) was less than half of today’s figure.
Wind’s share of total installed generating capacity as of June 30, 2024, was 11.75% – a significant increase from its 8.25% share five years earlier and 5.26% a decade ago.
Solar is the fastest-growing source of new capacity and generation
In the past decade, solar has ballooned from a fraction of a percent of both capacity and generation to become the second-largest renewable in both categories.
At the end of June 2014, utility-scale solar provided a mere 9.25 GW (0.75%) of total installed US generating capacity. Generation by utility-scale solar (8,535 GWh) was only 0.42% of the US total and EIA wasn’t even reporting generation by distributed, small-scale (i.e., <1 MW) systems yet.
However, five years later, solar capacity (39.13 GW) accounted for 3.27% of total utility-scale capacity. Actual generation by utility-scale facilities in the first half of 2019 had risen more than fourfold to 36,042 GWh (1.81% of the total) with small-scale solar contributing an additional 17,520 GWh (0.88%).
By the middle of 2024, installed solar capacity had risen to 8.99% of total utility-scale capacity. Utility-scale systems generated 102,614 GWh (4.86%) and small-scale systems added another 42,449 GWh (2.01%).
This rate of solar and wind growth has defied expectations. Three years ago, FERC had projected that installed utility-scale solar capacity would reach 105.04 GW by mid-year 2024. Solar’s actual capacity today is 11.2% more than FERC’s earlier forecast. In addition, wind’s installed capacity is now 2.4% higher than FERC had anticipated.
Hydropower and geothermal ebbs and flows, biomass drops
Over the past decade, the installed capacity of hydropower has edged up very slowly from 99.64 GW in June 2014 to 100.73 GW five years later and 100.88 GW today. Because the installed capacity of all energy sources combined has grown by over 8% during the past 10 years, hydropower’s share of capacity has gradually declined from 8.57% in 2014 to 8.41% in 2019, to 7.77% in 2024.
Electrical generation by US hydropower facilities has ebbed and flowed from year to year. For example, it was 140,65 GWh in the first half of 2014 (7% of the total) and then 153,790 GWh in mid-2019 (7.74%) and is now 126,139 GWh (5.97%) for the first six months of 2024.
Electrical generation by biomass, as well as its share of installed generating capacity, has been on a slow decline for the past 10 years. FERC data indicate that utility-scale biomass capacity dropped from 16.05 GW (1.37% of the total) in mid-2014 to 16.02 GW (1.34%) in mid-2019 to 14.54 GW (1.12%) in mid-2024. Correspondingly, actual electrical generation fell from 30,095 GWh (1.50%) during the first half of 2014 to 29,520 GWh (1.49%) five years later and then to 23,062 GWh (1.09%) this year.
The smallest renewable energy source – geothermal – has shown a pattern similar to that of hydropower. Its installed capacity has risen slightly from 3.87 GW in 2014 to 4.14 GW today, while its share of the US total has consistently hovered around 0.32-0.33%. Actual generation has ebbed and flowed over the past decade providing 8,108 GWh (0.40%) in the first six months of 2014, then 8,376 GWh (0.42%) in the first half of 2019, and now 7,640 GWh (0.36%).
“Notwithstanding minimal changes in the contributions by hydropower, biomass, and geothermal, renewable energy sources have doubled their share of US generating capacity and electrical output over the past 10 years thanks to explosive growth by both wind and solar,” noted the SUN DAY Campaign’s executive director Ken Bossong. “If the trends of the preceding decade continue, renewable energy sources could account for 40% or more of capacity and actual generation by 2035.”
Read more: Q3 2024 update: How many US EV charging ports there are now
If you live in an area that has frequent natural disaster events, and are interested in making your home more resilient to power outages, consider going solar and adding a battery storage system. To make sure you find a trusted, reliable solar installer near you that offers competitive pricing, check out EnergySage, a free service that makes it easy for you to go solar. They have hundreds of pre-vetted solar installers competing for your business, ensuring you get high quality solutions and save 20-30% compared to going it alone. Plus, it’s free to use and you won’t get sales calls until you select an installer and share your phone number with them.
Your personalized solar quotes are easy to compare online and you’ll get access to unbiased Energy Advisers to help you every step of the way. Get started here. –trusted affiliate link*
FTC: We use income earning auto affiliate links. More.

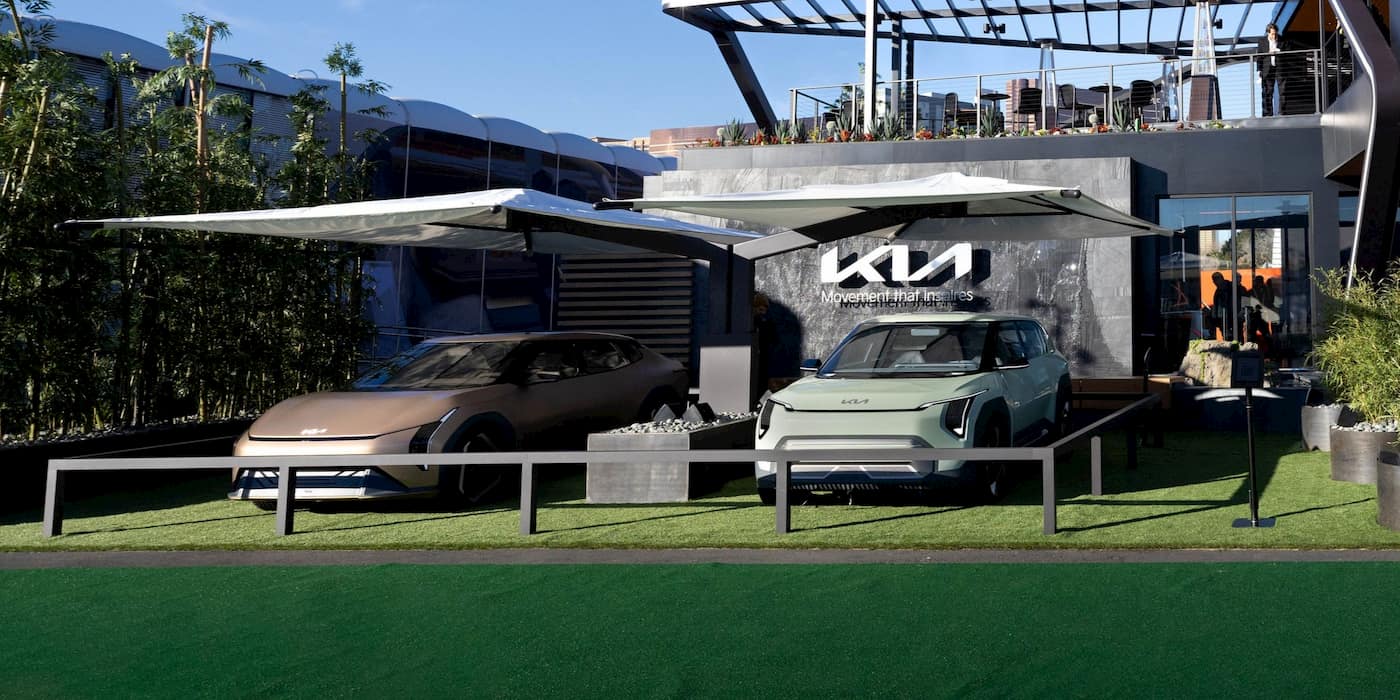
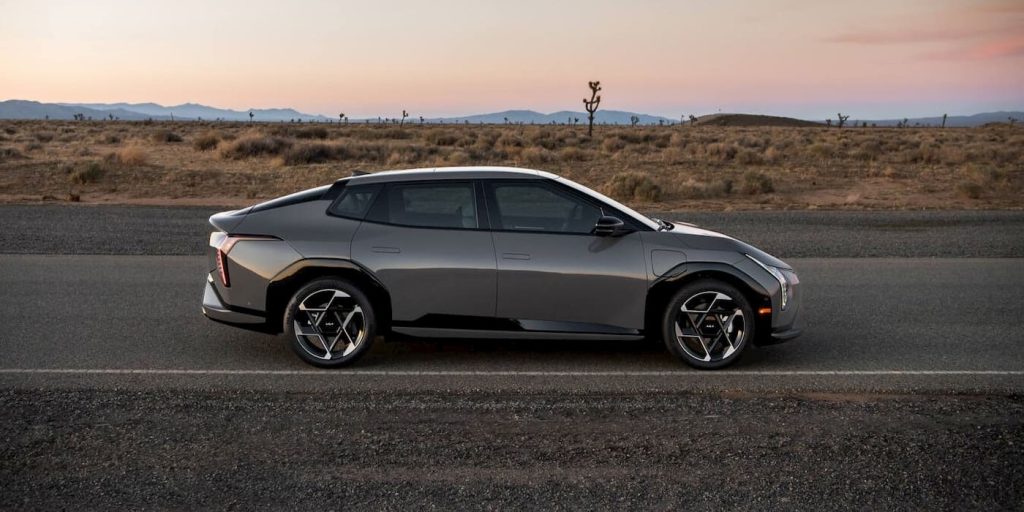
The EV4 will sadly not arrive in the US as expected, but Kia said it’s still planning on launching another EV that’s expected to be an even bigger hit.
Kia confirms EV4 delay, says another EV is still US-bound
The EV4, Kia’s first electric sedan, was expected to launch in the US within the next few months, but that will no longer be the case.
Kia has indefinitely delayed the launch of the EV4 in the US due to policy changes under the Trump administration.
The loss of the $7,500 federal EV tax credit and added tariffs on Korean imports have forced Kia, like many others, to adjust their US lineup.
According to Kia America’s marketing boss, Russel Wager, the EV4 is only a small part of the broader tariff-related impacts the Korean automaker is facing. Wager told Car and Driver on the sidelines of the LA Auto Show that the changes will likely impact other vehicles and prices.
When asked for specifics about why the EV4 is being pushed back, Wager said, “Can you give me the answer of when the tariffs are going to be resolved in Mexico, Canada, and Seoul? If you give me that answer, I’ll be as specific as possible.”
While the EV4 is delayed indefinitely, Wager suggested bringing the EV3 to the US, Kia’s compact SUV, is still part of the plan.
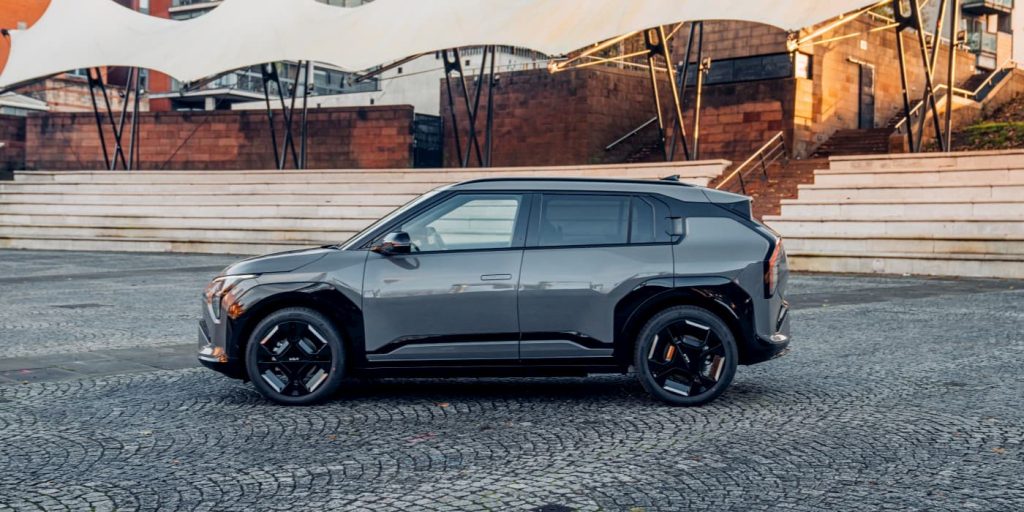
The Kia EV3 is already one of the most popular EVs in Europe and the UK’s best-selling retail electric car this year. Given the growing demand for smaller SUVs, the EV3 is expected to be an even bigger hit with US buyers than the EV4.
When it will launch in the US or how much it will cost remains up in the air until Kia gets a better idea of market conditions.
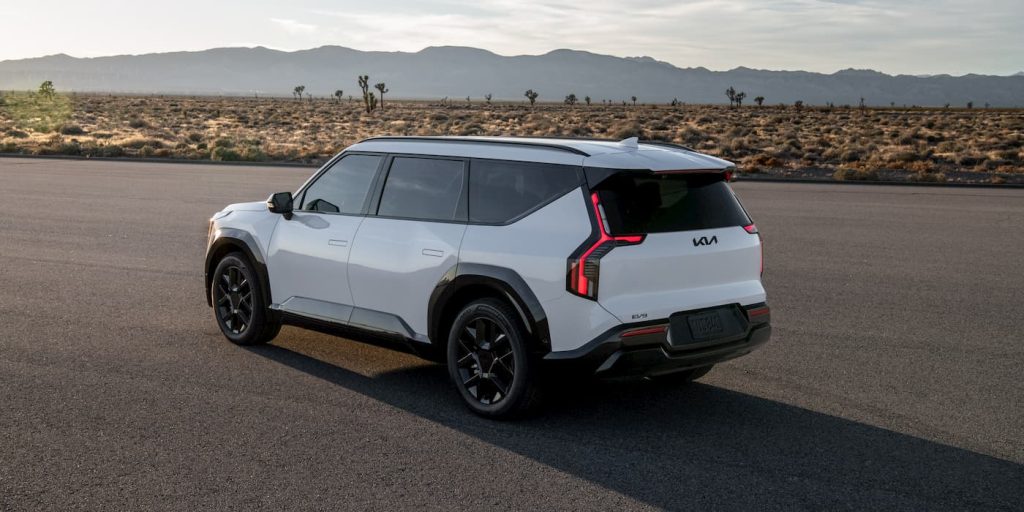
Kia’s EV sales plunged after the federal tax credit expired at the end of September. Sales of the EV6 and EV9 fell by 71% and 66% last month compared to October 2024.
According to Wager, the automaker won’t really know what demand looks like until February or March 2026, since the loss of the $7,500 credit likely pulled buyers forward.
Kia is still ready to launch the EV4 in the US, but that’s only if the tariff situation stabilizes. Earlier this month, the US and South Korea agreed to reduce tariffs on imports from 25% to 15%.
“At that point in time we look at it and say, are we at 25 [percent], are we at 15—and then we can build our business case,” Wager said, adding, “It was originally designed and engineered when the tariffs were zero percent.”
The electric pickup that Kia announced just a few months ago may never make it to the US. Wager pointed to Ford halting F-150 Lightning production and reports that it could be scrapped altogether.
In the meantime, Kia is heavily discounting its current electric vehicles, offering a $10,000 customer cash bonus on every model. Or, you can opt for 0% financing for 72 months plus an extra $2,500 bonus cash. Kia’s sister company, Hyundai, is also offering generous discounts with IONIQ 5 leases starting at just $189 per month.
Interested in a test drive? We can help you get started. You can use our links below to find Kia and
Hyundai models in your area.
FTC: We use income earning auto affiliate links. More.

A caravan of Chevy Silverado EVs will take the nearly 3,000-mile holiday trip across the US, lighting Christmas trees, surprising onlookers with light shows, and powering up festivities.
Chevy Silverado EVs gear up for a 3,000-mile trip
Chevy is celebrating the holidays with its fifth “Holiday Card to America,” but this year, the festivities will be brought to life.
Created in collaboration with Anomaly and Park Pictures, this season’s Holiday Card puts the spotlight on the ones that help bring the family together while keeping the traditions going: Moms.
The story follows an empty-nest couple through their holiday tradition, a trip to the family cottage in their 1987
Chevrolet Suburban.
The couple reminisces on past trips, with two kids and the family dog in the backseat, which are now empty. The 60-second ad will air on Thursday during the NFL football games on FOX and on the Chevrolet YouTube channel.
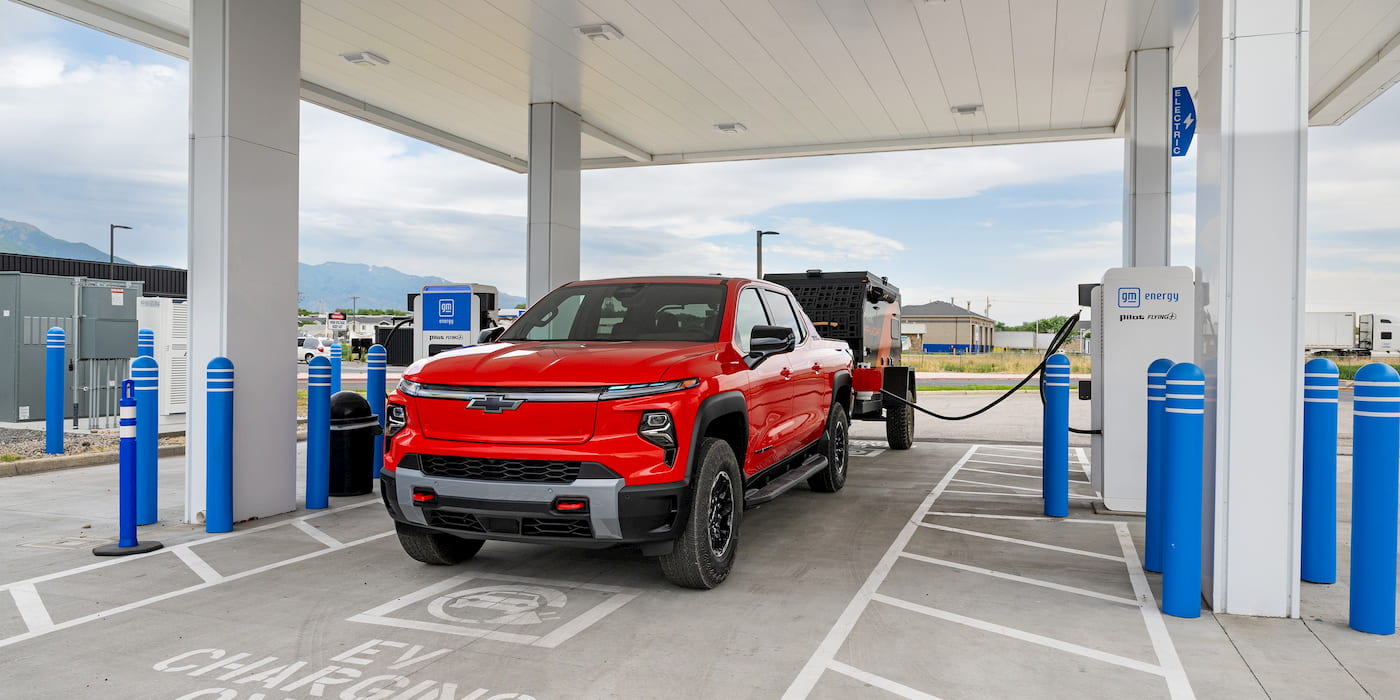
Starting December 1, a caravan of Chevy Silverado EVs will travel 2,987 miles across the US from San Diego to Detroit, with stops in Dallas, Nashville, and Atlanta.
The Chevy Silverado EV will light up events in each city, from illuminating the holiday tree to surprise light shows, to festive events where families can roast s’mores over a campfire while holiday caroling from local choirs plays in the background.
Chevy said the nearly 3,000-mile holiday trip is a testament to the electric pickup’s long range, fast charging, and mobile power capabilities.
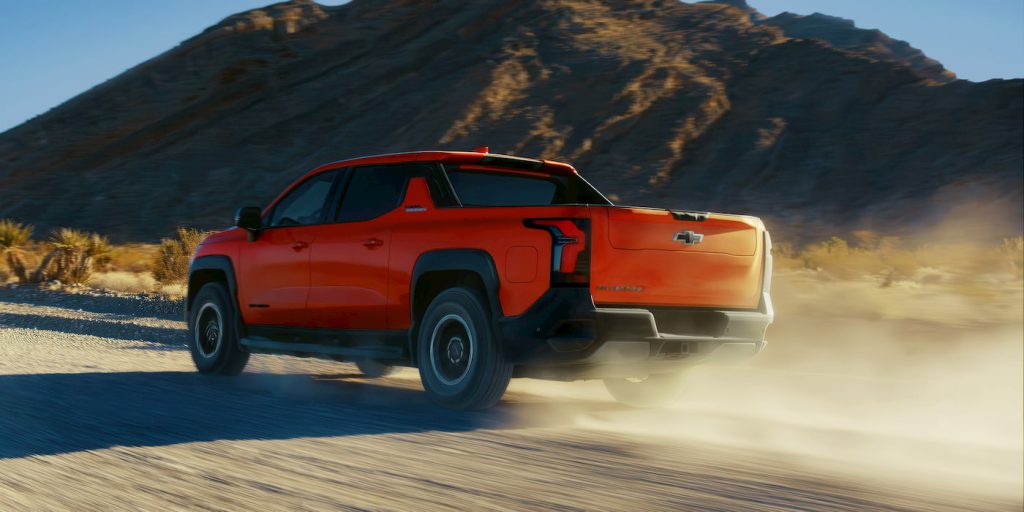
The Chevy Silverado EV provides an impressive driving range of up to 494 miles, can tow up to 12,500 lbs, and offers up to 10.2 kW of offboard power with up to 11 outlets.
The 2026 Chevy Silverado EV is available in three trims: Custom, LT, or a new Trail Boss edition, starting at $55,895.
With the 2026 models arriving, Chevy is offering 0% APR financing on all 2025 model year electric vehicles, including the Silverado EV, Blazer EV, and Equinox EV.
Interested in a test drive? We can help you get started. You can use our links below to find Chevy Silverado, Blazer, and Equinox EVs at a dealer near you.
FTC: We use income earning auto affiliate links. More.

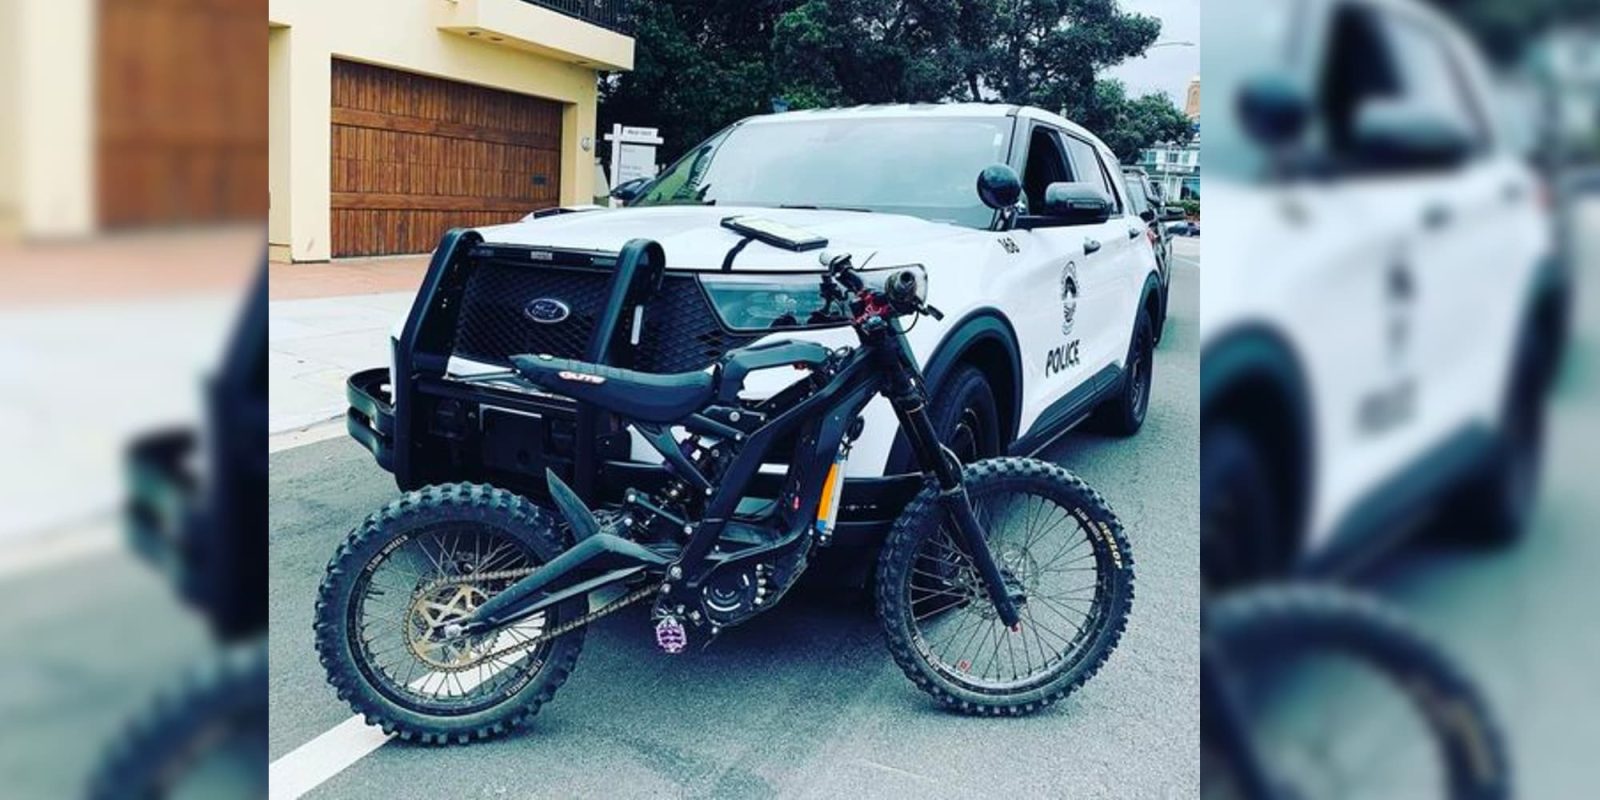
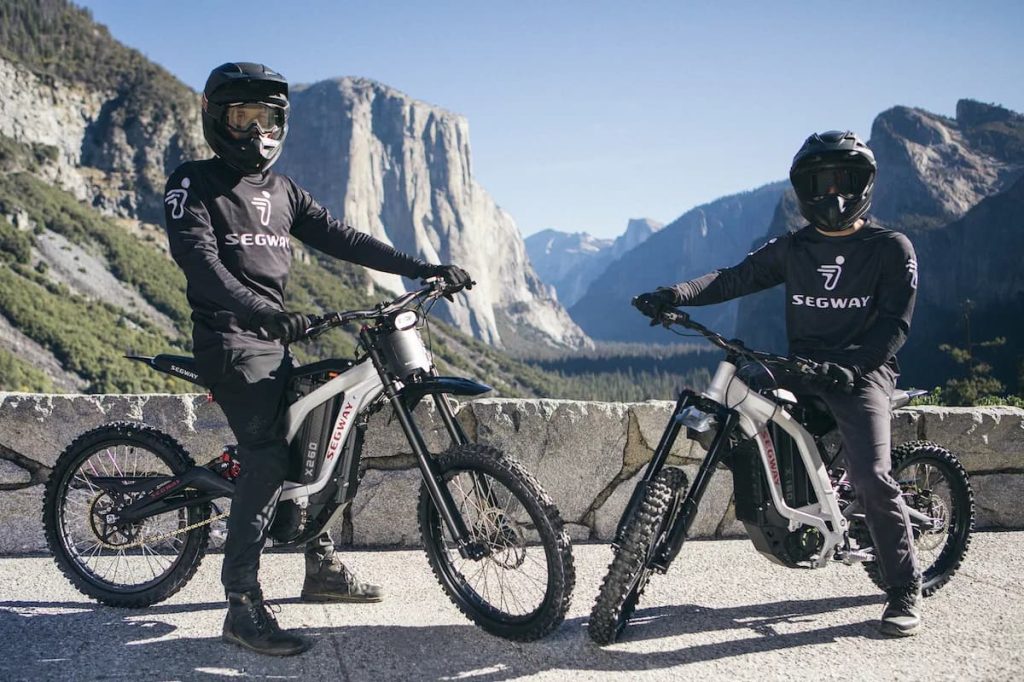
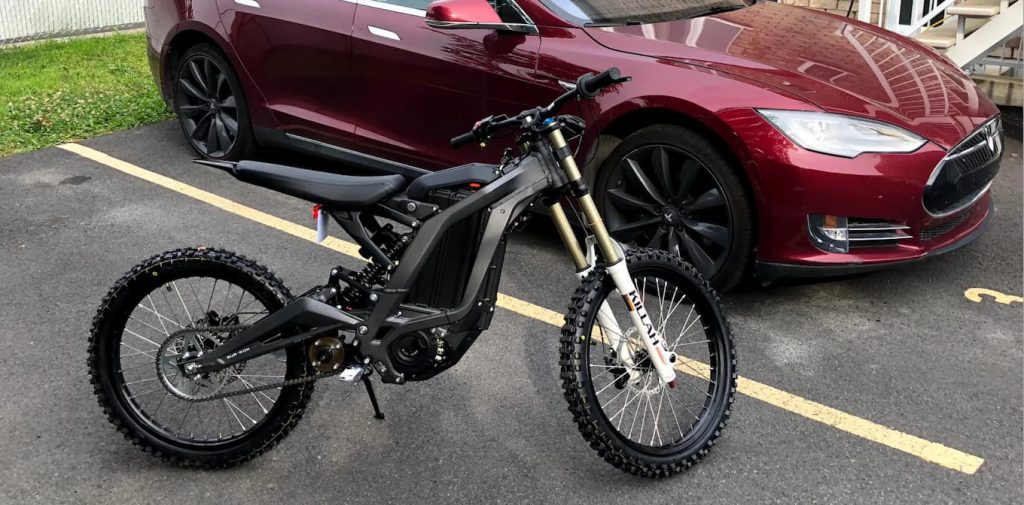
If you’re a parent of a teenager, there’s a decent chance you’ve heard the phrase “Can I get a Sur Ron?” sometime in the last year. Before you panic‑Google it or head to Amazon to see what one of these bikes costs, there are some important things you should know about this class of electric two-wheelers that have become all the rage with teenagers these days.
First, let’s clear something up: “Sur Ron” is technically one of many brands that makes these styles of bikes, but it’s become a catchall term – kind of like Kleenex. People often say “Sur Ron” when what they usually mean is any lightweight electric dirtbike with mountain‑bike styling and motorcycle performance.
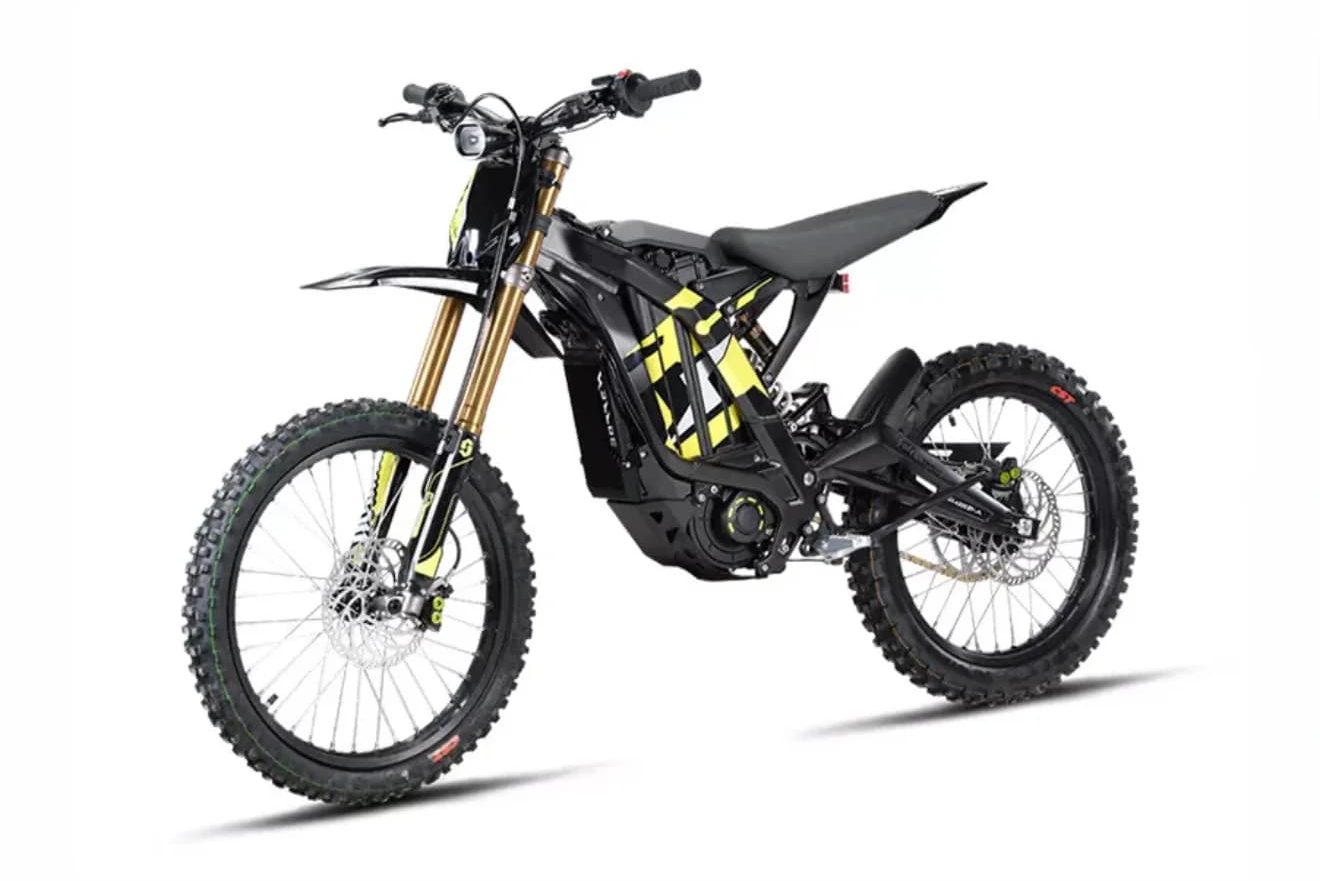
The brand Sur Ron may have kick-started the category, but now there are plenty of similar machines: Talaria, Tuttio, Rawrr, ERidePro, Segway X260, and plenty of smaller new brands popping up constantly. For the purposes of this topic, just look at whatever model your kid is asking for. If it looks like the pictures you’re seeing here in this article – dirtbike frame, no pedals, or offers 40+ mph speeds – then regardless of brand, you’re dealing with a “Sur Ron‑style” electric motorcycle.
And that brings us to the key reality parents need to know: A Sur Ron is not an electric bicycle. It is a light electric motorcycle.
Kids might not realize that when they’re begging for one after their friends got one. Many of these bikes are marketed with vaguely bicycle‑ish visuals, and influencers often ride them on public roads or on bike paths. But legally, practically, and mechanically, these machines are nowhere near the same thing as an electric bicycle – and that’s the core issue parents need to understand before clicking “Buy.”
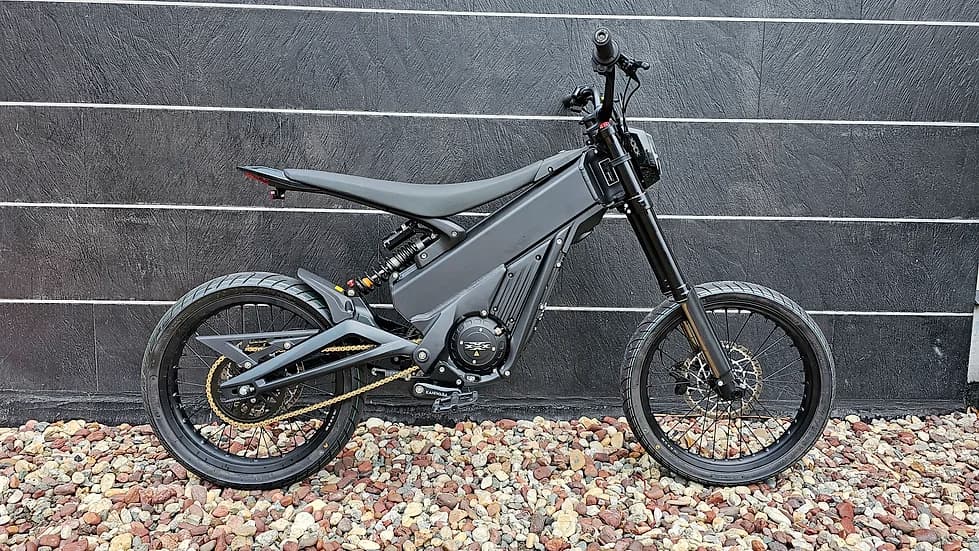
What is a Sur Ron, really?
Unlike a street-legal Class 1, 2, or 3 electric bicycle, a Sur Ron‑class bike:
- Has no spinning bicycle pedals
- Has a throttle-only drive system
- Usually tops out at around 40–50 mph (64-80 km/h)
- Is built like a lightweight motorcycle, not a bicycle
- Usually cannot legally be ridden on public roads, bike lanes, parks, or neighborhoods
There are a few exceptions to the street-legal issue, with brands such as NIU admirably homologating their designs for street-legal use. But this only further drives home the point, since such homologated models still require a motorcycle license to ride legally on public roads.
The point is, if it doesn’t have pedals and it goes over 28 mph, it’s not an electric bicycle almost anywhere in the US. That’s not my opinion – that’s how federal and state definitions work. Once you remove pedals and exceed those limits, you’ve crossed into motor vehicle territory.
Note: Part of the confusion stems from the vague term “e-bike”, which is often used to lump together everything from e-scooters and small electric bicycles to full-sized electric motorcycles. “E-bike” is morphing into a catchall term, but the legal classification of “electric bicycle” is what matters, and that legal denotation differentiates larger, non street-legal motorbikes from a street-legal two-wheeler.
Why do so many kids want one?
A huge part of the Sur Ron explosion has come from YouTube, TikTok, and Instagram videos showing teens doing wheelies, ripping around neighborhoods, and treating these machines like high-powered scooters. Kids see the cool factor, the speed, the off-road styling – and many assume they’re basically “super e-bikes.”
Well-known influencers regularly ride these types of bikes illegally on public roads and in bicycle lanes, often at speeds of up to 50 mph (80 km/h).
The marketing doesn’t help, either. Some retailers list these rides under the “E-Bike” category, even though they’re nowhere near legal electric bicycle specifications. Many come with easily defeatable speed limiters (more on that in a moment) to try to sneak by with questionable speed and power limits.
So in many cases, kids aren’t intentionally asking for a motorcycle. They simply don’t know the difference.
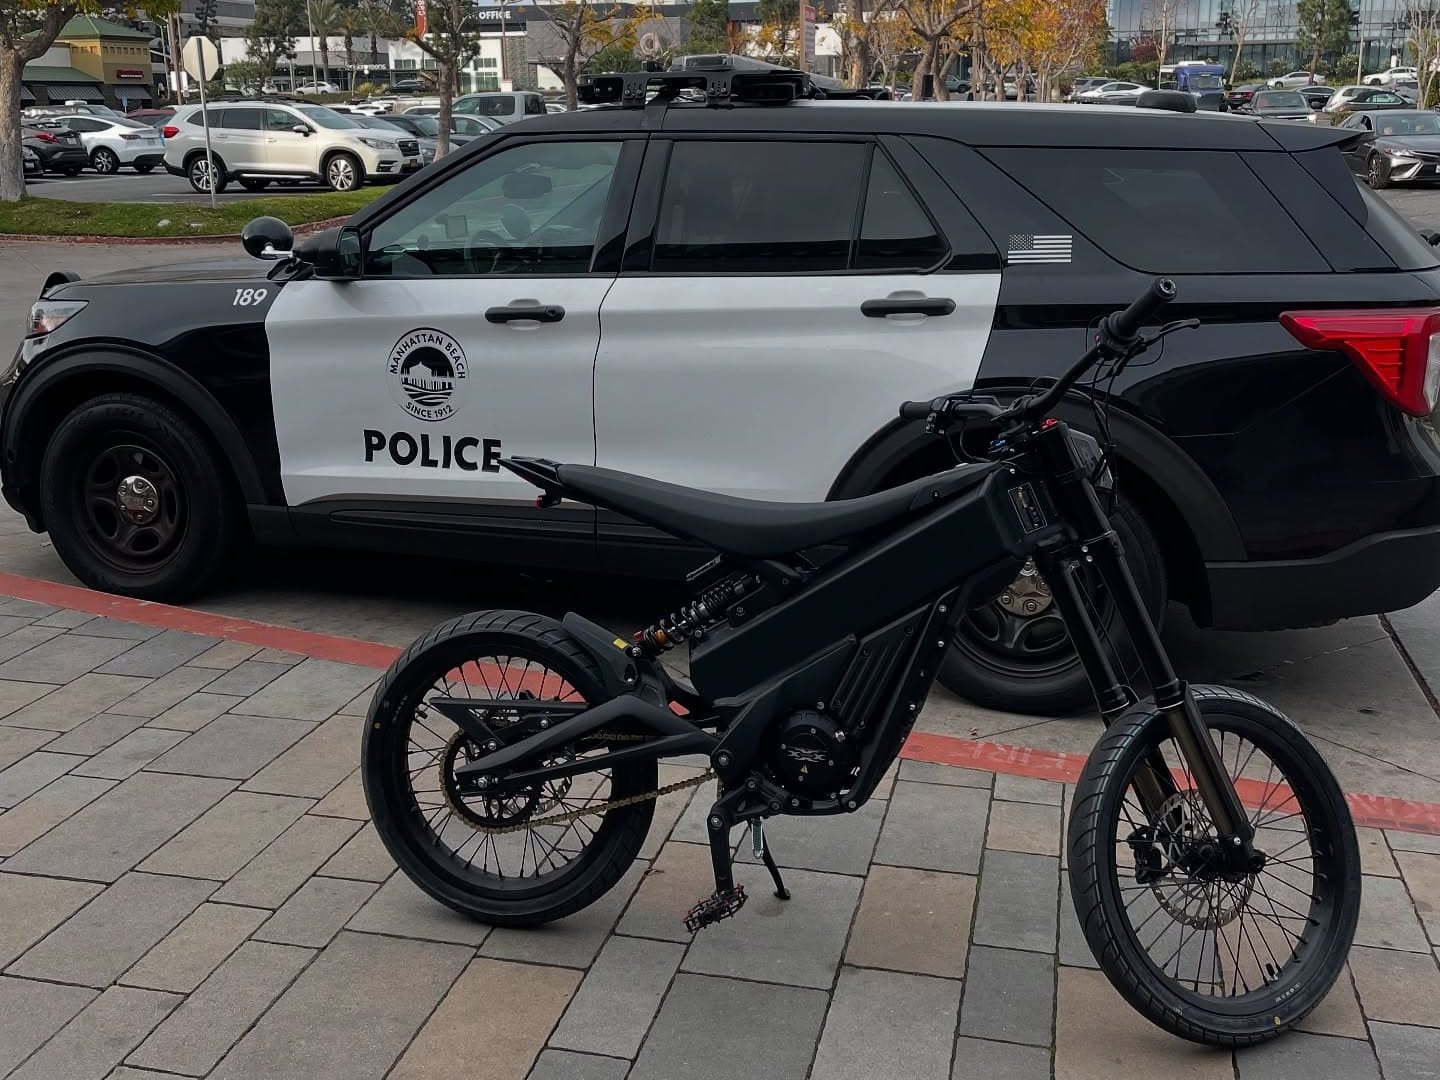
However, police are aware of the distinction, and they are increasingly confiscating these bikes when they are ridden illegally on public streets or bike lanes, especially by teenagers who are unfamiliar with the rules of the road.
The most important question for you: How do they plan to use it?
If your teen is asking for one of these motorbikes, consider asking them how they plan to use the vehicle before you decide what to buy.
If their answer is anything like…
- “Ride around the neighborhood”
- “Commute to school”
- “Go on the bike path”
- “Ride with my friends in town”
…then you can stop right there. A Sur Ron is not appropriate, safe, or legal for that type of riding.
What they need is a Class 1, 2, or 3 e‑bike – something with pedals, legal speed limits, and the ability to ride in bike lanes. There’s a healthy debate about which class is best for teens, but all three are at least street-legal and much safer than a Sur Ron or other light electric motorcycle for street and bike lane riding.
On the other hand, if your teen’s answer to why they want a Sur Ron is something like…
- “Trail riding”
- “Off-roading”
- “Learning motorcycle skills”
- “Riding on private land”
…then a Sur Ron‑class bike can be a great tool. With proper supervision, protective gear, and an appropriate place to ride, these bikes are fantastic learning platforms – and a ton of fun! They’re lightweight, don’t require clutch control, and have smooth throttles that make them more approachable than gasoline-powered dirt bikes. In fact, I’d say that they’re one of the best ways to learn motorcycle and dirt bike skills. Just be sure to get your kid geared up with the proper safety equipment, like a good helmet, gloves, and protective clothing. I really like a company called Beyond Riders (I have no affiliation) and I wear their armored jackets and pants on my full-size motorcycles – that’s how good they are.
Ask yourself honestly: Would you buy your kid a small motorcycle?
Just because it’s electric doesn’t make it any less powerful. If you wouldn’t buy your kid a motorcycle, then it doesn’t make sense to get them a Sur Ron. It’s just a motorcycle that you don’t fill up with gasoline.
Many of these models may claim to be limited to 20 mph (32 km/h), but they almost all have an easily bypassed speed limiter – often a single wire designed to be cut – that allows their top speed to be increased to around 40-50 mph. Electrek’s own publisher has talked before in our e-bike podcast about how his family’s Talaria seems to mysteriously have its speed limiter wire repeatedly cut after his teenager uses it.
These aren’t toys, and they’re not bicycles. They require the same level of responsibility, gear, and supervision as a gas dirt bike.
And depending on where you live, there can be serious legal consequences if your kid rides one on the street: tickets, fines, or worse, liability in the event of a crash.

So what should parents buy instead?
It may appear to some that this article or my views are anti-Sur Ron, but in fact, it’s the opposite. These are great machines, and it’s awesome that they exist. But like many things in life, context is important. These aren’t commuter tools (unless they’re homologated for street-legal riding and the rider has a motorcycle lesson). These are trail bikes for off-road riding.
If your kid’s goal is everyday riding – school commutes, local cruising, bike-path adventures – then you want a proper electric bicycle. Not a Sur Ron.
Look for reputable Class 1, Class 2 or Class 3 e-bikes from brands that make real electric bicycles (things that look like pedal-able bicycles with batteries). Brands like Lectric eBikes, Ride1Up, Aventon, Trek, Rad Power Bikes (while they last), and others are all great, affordable options for families searching for a teenager’s first e-bike. That is by no means an exhaustive list, but they are some of the most popular among younger, budget-minded riders looking for something safe and legal.
These brands all offer models with real pedals, legal speed limits, safer handling, and that won’t get your kid in trouble for riding where motorcycles don’t belong.
Final thoughts: Be real, be safe, and match the bike to the mission
It’s awesome that your kid is excited about electric mobility. That’s something worth supporting. But the right choice depends entirely on how – and where – they plan to ride.
A Sur Ron‑class bike is an amazing off-road machine, and a fantastic training motorcycle. But if the plan is to ride around town, go to school, or stick to bike paths, then it’s absolutely the wrong choice.
There’s no shame in saying “no” to the motorcycle and “yes” to a legal e-bike.
As with all things electric on two wheels, the key is to pick the right tool for the job. And despite the hype, a Sur Ron is not a bicycle. It’s a motorcycle. A fun, capable, impressive motorcycle – but one that needs to be used in the right place, with the right gear, and for the right reasons.
FTC: We use income earning auto affiliate links. More.
-
 Sports2 years ago
Story injured on diving stop, exits Red Sox game
-
 Sports3 years ago
‘Storybook stuff’: Inside the night Bryce Harper sent the Phillies to the World Series
-
 Sports2 years ago
Game 1 of WS least-watched in recorded history
-
 Sports3 years ago
Button battles heat exhaustion in NASCAR debut
-
 Sports3 years ago
MLB Rank 2023: Ranking baseball’s top 100 players
-
Sports4 years ago
Team Europe easily wins 4th straight Laver Cup
-
 Environment3 years ago
Japan and South Korea have a lot at stake in a free and open South China Sea
-
 Environment1 year ago
Here are the best electric bikes you can buy at every price level in October 2024