

From health to depth to the entire offense: One thing that must change for all 30 MLB teams

-
Bradford Doolittle
Something has to change.
Of course, much has already changed since we last convened with our final preseason projections. But for each MLB team, playing five weeks of a new season will inevitably expose additional shifts that are needed. Every team, no matter how splendid or how dreadful the start, has something.
One thing the forecasts suggested that has borne out so far is the relative levels of stratification between the leagues. The National League, led by the champion Dodgers, looked top-heavy, and while not all of the teams we thought would make up that elite tier are a perfect match with the forecasts, the overall dynamic is very much one of dominance. Meanwhile, the American League figured to be a whole bunch of teams in spitting distance of break even, with little separation among the top 12-13 teams in the circuit.
How will these dynamics hold up until we Stock Watch again in June?
Each team’s ability, or lack thereof, to make the following changes might determine that.
![]()
Win average: 104.5 (Last: 102.4, 1st)
In the playoffs: 98.8% (Last: 97.7%)
Champions: 28.5% (Last: 28.4%)
What must change: Rotation health
There were actually some bumpy moments in the early weeks of the season for the Dodgers but nothing has happened to really knock them out of the favorite’s perch as we think ahead to late October. One thing that could change that is L.A.’s ever-growing injured list, especially its collection of 60-day IL assignments. For all the depth the Dodgers seemed to build up in their rotation over the winter, they’ve still gone with two bullpen games already. And this doesn’t even include Shohei Ohtani, who’s still building up so he can take his turns in the rotation. Given their recent history of starter injuries … maybe he shouldn’t? Including the two openers, the Dodgers have already had 10 different pitchers start games.
![]()
Win average: 96.0 (Last: 90.2, 3rd)
In the playoffs: 88.6% (Last: 73.5%)
Champions: 10.5% (Last: 6.0%)
What must change: Middle relief instability
There hasn’t been much to complain about with the Mets. Though New York hasn’t overtaken the Dodgers in the simulations from a going-forward perspective, the Mets have probably been the better team to this point. The Dodgers have the better winning percentage, but the Mets’ Pythagorean pace (109.7) is the National League’s best. With not much to nitpick about, the relief contingent in front of Edwin Diaz needs to coalesce a little more. Ryne Stanek has the pen’s second-highest average leverage index but has struggled, and the two top lefties (A.J. Minter and Danny Young) have already been lost to injury. Still, if this is a team’s biggest worry at the beginning of May, it’s in a good place.
![]()
Win average: 95.8 (Last: 84.3, 13th)
In the playoffs: 92.7% (Last: 51.2%)
Champions: 7.8% (Last: 1.5%)
What must change: Ninth-inning drama
The Cubs have mostly bludgeoned their opposition so far with a breakout offense that ranks among baseball’s best in pretty much every major category. Assuming Chicago won’t average over six runs per game all season, eventually its thin bullpen is going to move into the spotlight. The Cubs have blown seven of their first 15 save opportunities. Closer Ryan Pressly has managed to white-knuckle his way through most of his outings but has struck out fewer than four batters per nine innings, with more walks than K’s. Overall, Chicago’s relievers rank 28th in swing-and-miss percentage, underscoring the general lack of dominance in that unit. The Cubs have been strong in every other facet but for them to establish themselves as a true front-runner, the relief leaks will need to be shored up.
![]()
Win average: 93.7 (Last: 83.0, 16th)
In the playoffs: 91.7% (Last: 41.2%)
Champions: 10.1% (Last: 1.8%)
What must change: Shortstop play
You hate to pick on Trey Sweeney, who accounts for most of Detroit’s starts at shortstop, but there just aren’t many shortcomings for the Tigers so far. No team has improved its forecast more since the start of the season. Detroit is now landing a No. 1 playoff seed more often than any other AL team in the simulations, though the Yankees’ pennant odds are still a tick better because of a higher baseline. (New York has a lower regular-season win forecast because of schedule differences.) Sweeney hasn’t hit (.234/.317/.355)* and the Tigers’ shortstop defensive rating, per FanGraphs, ranks 20th. It’s the most obvious blemish on what is shaping up as a pristine season in Detroit.
* These numbers were .202/.282/.303 entering Sunday, but Sweeney must have had spies watching over my shoulder. Against the Angels, he went 4-for-5 with a homer and six RBIs. That’s more like it.
![]()
Win average: 92.9 (Last: 84.5, 12th)
In the playoffs: 76.9% (Last: 44.4%)
Champions: 4.0% (Last: 1.8%)
What must change: Lineup depth
The Padres are off to a great start, largely on the strength of a bullpen that has been off the charts. The relievers have racked up 14 saves (they’ve blown only one) and 27 holds while compiling a collective 1.73 ERA. Those numbers are both unbelievable and unsustainable. When some regression sets in, a top-heavy lineup will need to get production from spots like catcher (21st in OPS) and left field (27th) to offset the difference. We kind of knew this was how the Padres were constructed, but still — San Diego has given too many plate appearances to too many players in what we’ll call the post-productive phases of their careers.
![]()
Win average: 91.4 (Last: 84.3, 13th)
In the playoffs: 85.4% (Last: 46.8%)
Champions: 8.1% (Last: 2.5%)
What must change: First base production
Generally speaking, the more specific the issue we choose to worry about, the better off the team. For Seattle, the primary concern the past couple of years has been more wide-lens than specific: offense. For now, that problem has apparently been largely solved. The Mariners’ offense has been one of the hottest in baseball and over the past couple of weeks, with its hitters even managing to mash at T-Mobile Park. So rather than worrying about the offense, writ large, we can point out that at first base, the Rowdy Tellez–Donovan Solano combo is mostly responsible for Seattle’s .518 OPS (tied for 29th in MLB) at the position. This projected to be a major hole before the season, so the chances of self-correction are limited. Now, the stakes are higher to shore up the weak spots, since the Mariners have emerged as the early front-runner to win the AL West.
![]()
Win average: 90.8 (Last: 88.7, 5th)
In the playoffs: 84.5% (Last: 68.3%)
Champions: 9.3% (Last: 6.5%)
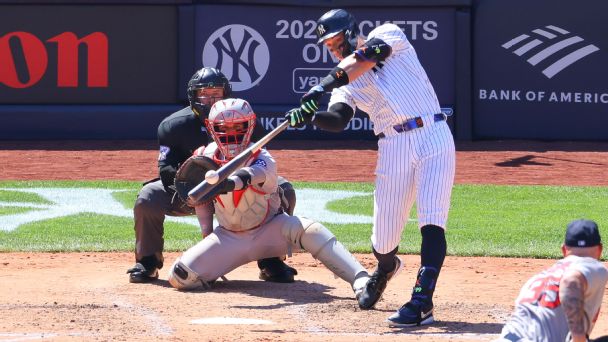
What must change: Rotation depth chart
For a first-place team, there is plenty to worry about when it comes to the Yankees. They’ve had the best position player (Aaron Judge, by far) and arguably the best pitcher (Max Fried) in baseball. The relief staff has dealt with the struggles of demoted closer Devin Williams, but the bullpen still ranks sixth in relief ERA and with only 14% of inherited runners scoring. But the rotation has been below average (4.07 ERA and only eight quality starts) despite Fried’s great beginning. Even worse, with Gerrit Cole out for the season and Luis Gil and Marcus Stroman currently on the shelf, it’s not immediately clear how this is going to get better. This issue might really start to mushroom if and when Fried regresses from his hot start.
![]()
Win average: 90.3 (Last: 89.2, 4th)
In the playoffs: 66.2% (Last: 68.9%)
Champions: 4.1% (Last: 4.8%)
What must change: Slumping stalwarts
The Phillies’ roster was constructed on star power, not depth, and while that has worked well enough the past few years, they need the stars to produce. The “it’s still early” caveat applies, but so far, Bryce Harper hasn’t hit like Bryce Harper, Alec Bohm‘s production has gone missing, Aaron Nola just earned his first win but remains under league average (91 ERA+) and key bullpen acquisition Jordan Romano has gotten shelled. If the Phillies don’t want to lose sight of the front-running Mets in the NL East race, they’ll need their main cogs to start firing.
![]()
Win average: 89.7 (Last: 79.9, 20th)
In the playoffs: 59.7% (Last: 24.6%)
Champions: 2.5% (Last: 0.6%)
What must change: Team batting average
The Giants have inserted themselves into a top-heavy NL postseason chase that they didn’t figure to be a part of when the season began. The pitching and defense has been stellar, but the offense hasn’t kept up. San Francisco ranks eighth in walks percentage but 24th in batting average. That can work in a take-and-rake general approach to offense, but the Giants are only middle of the pack in homers. Since they aren’t very athletic and rarely steal bases, this leads to uneven production. The Giants can hang in contention with a league-level batting average, but they simply don’t hit enough homers to do so if they continue to hover around .230. That puts the onus on low-average hitters such as Matt Chapman (.198), LaMonte Wade Jr. (.141, ouch) and Willy Adames (.230 and now four homers after hitting two on Sunday) to up the ante.
![]()
Win average: 87.1 (Last: 87.1, 8th)
In the playoffs: 44.2% (Last: 58.4%)
Champions: 1.7% (Last: 3.0%)
What must change: Bullpen health
In what’s shaping up as a historically good NL West (save for the Rockies), little problems can quickly become big ones. For the Diamondbacks, a shiny start has lost its luster a bit as they have battled bullpen problems in both the performance and health categories. The unit scuffled badly during a 5-9 stretch, posting a 5.61 collective ERA while blowing six of 10 save opportunities. Closer A.J. Puk (elbow) is on the 60-day IL and Justin Martinez (shoulder) hit the 15-day IL after two concerning outings with diminished velocity. Both are expected to help later this season but for that to matter, the likes of Kevin Ginkel, Shelby Miller and Ryan Thompson need to step up in high-leverage spots.
![]()
Win average: 86.8(Last: 88.7, 5th)
In the playoffs: 66.6% (Last: 68.7%)
Champions: 3.7% (Last: 5.4%)
What must change: Homer count
It has been a mixed bag for the Astros. Hunter Brown has been one of the game’s best pitchers and Josh Hader is having a vintage season at the back of the bullpen. The relief staff, in general, has been strong. But the lineup has been below average with a lack of power at the root of the issue. No Astro has homered more than four times and Houston ranks 21st in home run and overall slugging percentage. It’s an issue up and down the lineup but things would look a lot more promising if Christian Walker and Yordan Alvarez were going deep at their usual rates.
![]()
Win average: 86.7 (Last: 96.5, 2nd)
In the playoffs: 43.5% (Last: 91.1%)
Champions: 2.2% (Last: 14.4%)
What must change: IL roster
An 0-7 start threatened to sink the Braves’ season before it began. They recovered — nearly climbing to .500 at one point — but they have a lot of work to do. Hopes that the Braves can still reach their ceiling hinge on the longed-for returns of Spencer Strider and Ronald Acuña Jr. In the meantime, they need underperforming stalwarts such as Matt Olson, Michael Harris II, Chris Sale and Raisel Iglesias to hit their stride. Atlanta can’t keep plodding along under .500 in this year’s NL while waiting for its stars to get healthy, but if the Braves can stay above water until then, they might be able to really take off. Considering what we’ve seen so far, the fact that they won’t see the Dodgers again during the regular season certainly helps.
![]()
Win average: 83.6 (Last: 84.6, 11th)
In the playoffs: 47.4% (Last: 48.8%)
Champions: 1.3% (Last: 2.3%)
What must change: Outfield production
The Royals’ offense, in general, has been missing, with only Bobby Witt Jr. producing all season. But the outfield ranks 29th in bWAR as a group — the continuation of a problem that hovered over the roster last season. MJ Melendez was sent to the minors to find himself. His initial results in Omaha suggest he’ll be searching for some time. Hunter Renfroe has produced less than a good-hitting pitcher. Mark Canha has helped in a big role and Drew Waters has had some nice moments. But the Royals need some stable offense from the corner outfielders, making this a must-get as the trade deadline starts to loom.
![]()
Win average: 82.9 (Last: 77.7, 22nd)
In the playoffs: 40.9% (Last: 19.0%)
Champions: 0.9% (Last: 0.5%)
What must change: Emmanuel Clase
You figured the Guardians’ bullpen would fall off a bit after last season’s off-the-charts showing. That has happened even though set-up relievers Cade Smith and Hunter Gaddis have been every bit as good as they were in 2024. No, the problem has been a mystifying start by Clase, who has already given up more runs (11) than he did all of last season (10). He already has won four games, matching a career high, but of course that’s not necessarily a good sign for a closer. Clase’s dominance was the biggest differentiator on last year’s team. The 2025 squad, which has been outscored by 23 runs despite a 20-14 record, needs him to approximate that performance.
![]()
Win average: 82.8 (Last: 84.1, 15th)
In the playoffs: 43.6% (Last: 45.6%)
Champions: 1.8% (Last: 2.5%)
What must change: Bullpen depth
Despite an elite offense, the Red Sox have hovered around .500 because of a thin bullpen. The relievers have blown as many saves (eight) as they’ve converted and only one team has seen a higher rate of inherited runners score. Closer Aroldis Chapman has been fine, but he hasn’t had enough situational help. Boston ranks in the middle of the pack with a 4.11 relief ERA and its 10 holds are tied for the fewest of any bullpen. The rotation has been solid, but it’ll need more support to remain that way.
![]()
Win average: 81.9 (Last: 87.1, 8th)
In the playoffs: 38.1% (Last: 61.0%)
Champions: 1.1% (Last: 5.2%)
What must change: The offense
Even after an eight-run outburst against the division-leading Mariners on Sunday, Texas ranks 29th in run scoring. Only the Rockies have scored fewer. It’s a stunning turnaround for an offense that kept scoreboards spinning in 2023 on the way to a World Series title. Last year’s falloff was steep, and based on what we’ve seen so far, hopes for positive regression are fading. Adolis Garcia is having another down season. Marcus Semien is below replacement. And the key additions from the winter — Joc Pederson and Jake Burger — have hurt more than they’ve helped. Pederson is hitting a remarkable .094 with a .334 OPS, and Burger (.561) was sent to the minors. Not good. The Rangers’ brass has taken note: Offensive coordinator Donnie Ecker, who was with the club during its 2023 run, was fired after Sunday’s game.
![]()
Win average: 79.5 (Last: 85.1, 10th)
In the playoffs: 25.7% (Last: 52.4%)
Champions: 0.7% (Last: 2.7%)
What must change: Carlos Correa
For once, we don’t have to cite the availability of the Twins’ stars as their primary problem. That’s still an issue, too, as Royce Lewis has yet to make his season debut — but the larger problem has been the star who has stayed on the field, Correa, is off to a miserable start. He’s hitting .216 with a lone homer and a .560 OPS to begin the season, hamstringing a Twins lineup that has struggled. Everything is off, even Correa’s plate discipline, as he has walked at a rate less than half his career norm. The Twins need more to turn around than just Correa, but no one else on the roster has fallen as far below expectation as he has.
![]()
Win average: 79.4 (Last: 82.9, 17th)
In the playoffs: 25.0% (Last: 39.2%)
Champions: 0.6% (Last: 1.6%)
What must change: Powerless stars
After the formerly punchless Royals hammered seven homers in Baltimore on Sunday, the Blue Jays sank to last in the majors with 23 homers. The power trio of Vladimir Guerrero Jr., Anthony Santander and Bo Bichette have hit nine of those dingers between them — and that’s just not enough. Guerrero will be fine. Bichette has recovered most of the batting average he lost during last year’s .225 season, but he has homered only once. This is a player in his age-27 season who topped 20 homers in each season from 2021 to 2023. Finally, Santander has flailed during his first Toronto season, hitting four homers with a 67 OPS+. This can’t continue if the Jays are to contend.
![]()
Win average: 79.1 (Last: 79.9, 20th)
In the playoffs: 11.4% (Last: 28.9%)
Champions: 0.1% (Last: 0.5%)
What must change: The pitching
The Brewers are built to win on pitching and defense. Every year, they overperform their projections because of an organizational ability to find, or produce, quality pitchers. But so far, they just haven’t found enough of them in 2025. The overall run prevention has been off. In the first season after Willy Adames’ departure, the team defense has been more decent than elite. The rotation has received good work from Freddy Peralta, Jose Quintana and upstart Chad Patrick, but the falloff after that has been steep. Brandon Woodruff might return to the mix soon and that will certainly help. More troubling is Milwaukee’s normally airtight relief staff, which has struggled to finish games and strand inherited runners.
This all needs to turn around — and fast. With the Cubs emerging as a potential powerhouse in the NL Central, being an above-average team is no longer the bar to clear in the division. And it’s unlikely the Central’s second-place club is going to have a chance at a wild-card slot — not in this league.
![]()
Win average: 78.8 (Last: 80.3, 19th)
In the playoffs: 22.3% (Last: 27.1%)
Champions: 0.5% (Last: 0.8%)
What must change: Home-field disadvantage
No matter what happened, this was going to be a strange season for the Rays. Playing in a minor league facility owned by a division rival was going to take some getting used to. The problem for the Rays is that they need to get used to it quickly, because of a schedule heavy on early home games. When the Rays depart for a six-game trip on June 8, they will have played nearly twice as many games in Tampa (43) as on the road (22). That means, of course, that the Rays will have a road-heavy schedule after that, which would be fine if the Rays were playing well at George M. Steinbrenner Field — but they aren’t. When the Rays return to Florida on Tuesday, they’ll be 9-13 at their temporary venue. With a lot more games in Tampa coming up, it’s an issue they need to fix fast. If they don’t, they’ll be looking at an uphill battle for playoff contention, and most of those hills will be confronted away from home.
![]()
Win average: 78.8 (Last: 75.9, 23rd)
In the playoffs: 10.6% (Last: 14.6%)
Champions: 0.2% (Last: 0.2%)
What must change: Lead protection
The Reds might be good. The pitching staff (122 ERA+) ranks third in the NL. The rotation and the bullpen have contributed even though presumed closer Alexis Diaz floundered so badly that he was sent to the minors. Emilio Pagan has been OK in Diaz’s place, but he’s better suited for set-up work. Diaz’s trouble started last season, so it’s hard to say where his trajectory is headed. Recently recalled Luis Mey has electric stuff, but he’s unproven and prone to lapses of command. However it happens, manager Terry Francona needs someone to step up to lock down the ninth because the overall pitching is contention-worthy. The lineup … well, it’s another reason why the Reds can’t afford back-of-the-bullpen inconsistency.
![]()
Win average: 77.5 (Last: 73.5, 26th)
In the playoffs: 16.1% (Last: 8.4%)
Champions: 0.2% (Last: 0.1%)
What must change: The defense
This is shaping up as an exciting first season in Sacramento for the Athletics. The offense has been productive and looks legit, especially if rookie Nick Kurtz hits the ground running. The pitching is going to be more of a scramble, but what would help if the Athletics could field. They rank last or second to last in the leading defensive metrics. Only the Red Sox have committed more errors. Some teams can overwhelm opponents by favoring offense over defense at most positions, but the Athletics aren’t likely to be one of them. Key spots to shore up are second base and third base, positions that aren’t producing at the plate, either, so at the very least the Athletics could favor a glove.
![]()
Win average: 76.8 (Last: 81.0, 18th)
In the playoffs: 6.4% (Last: 33.9%)
Champions: 0.1% (Last: 0.7%)
What must change: Ryan Helsley
The Cardinals are perfectly mediocre, owning a run differential that has hovered around break even. Their record is a little worse than the expectation the so-so differential portends, largely because of a 4-5 record in one-run games — two of those coming in Sunday’s doubleheader against the Mets. This is not exclusively because of Helsley, but he has not been on his game so far with two blown saves in seven chances and walking nearly as many batters as he has struck out. The strikeout and walk rates are alarming, as they reflect what Helsley was early in his career before he ascended to All-Star status. If the mediocre Cardinals are going to do better than middling, they need their star closer to help them close out more than their share of close games. The kicker, though, is that if the Cardinals go into offload mode, this version of Helsley isn’t going to look nearly as alluring in the trade marketplace.
![]()
Win average: 75.7 (Last: 88.0, 7th)
In the playoffs: 11.7% (Last: 64.7%)
Champions: 0.2% (Last: 5.9%)
What must change: Right-handed hitting
No team has lost more from its preseason projection than Baltimore, so it’s very difficult to boil it down to one big thing. The problem with right-handed hitting could also be framed as a problem with hitting left-handed pitchers. The Orioles rank fifth with a .774 OPS against righties but are dead last against lefties (an anemic .502). Their righty hitters (Tyler O’Neill, Jordan Westburg, Gary Sanchez, et al.) are hitting a collective .200/.261/.319. This of course comes after the Orioles moved in the left-field fence at Camden Yards over the winter. How’s that going? Opposing righty hitters have a .972 OPS there, while their Baltimore counterparts are at .586. The visitors have outhomered Baltimore’s righty swingers 20-8 at Oriole Park.
![]()
Win average: 70.5 (Last: 67.7, 27th)
In the playoffs: 0.9% (Last: 1.9%)
Champions: 0.0% (Last: 0.0%)
What must change: Dylan Crews
The Nationals are competitive already and often fun to watch. Actual contention seems like a longshot, though, especially given the current state of their bullpen. Still, the more long-term questions the Nationals can answer in the affirmative, the better they will be able to set themselves up for a real push in 2026. At some point, infield prospect Brady House should join the big league fray. Until that happens, eyeballs remain on Crews, the touted second-year player whose MLB career has sputtered at the beginning. Crews looked lost early, going 5-for-47 with zero extra-base hits to start. Then came a two-week splurge with four homers and a 1.026 OPS over 13 outings. He’s 1-for-21 since. More than anything, Crews needs to get off the roller coaster and enjoy a nice, prolonged run of good, solid consistency.
![]()
Win average: 66.8 (Last: 73.8, 25th)
In the playoffs: 0.9% (Last: 8.9%)
Champions: 0.0% (Last: 0.1%)
What must change: Roster make-up
What do I mean by “roster make-up”? Remember the glory days of April 12, when L.A. was 9-5 and it seemed its floor-raising project from the winter was going to work? Since then, the Angels have a minus-65 run differential, 14 runs worse than any other team and, yes, that includes the Rockies. And also, Mike Trout is back on the injured list. The Angels are in the bottom five in OPS, ERA and defensive runs saved. This incidentally isn’t a tanking team. So how to change the roster makeup? Maybe just go young and lose big? The losing might happen anyway and, besides, what the Angels are doing now is not working.
![]()
Win average: 66.0 (Last: 74.2, 24th)
In the playoffs: 0.2% (Last: 10.4%)
Champions: 0.0% (Last: 0.1%)
What must change: Oneil Cruz‘s defense
According to baseball-reference.com, Cruz’s offense has been nine runs better than average, once you combine his hitting (.243/.377/.505 with eight homers) and baserunning (14 steals). His defensive performance in center field is minus-9 runs, erasing all of that offensive value. His bWAR (0.5) is a product of accounting — positional value and replacement value. Cruz is now minus-12 in fielding runs over the past two seasons in center. His career figure at shortstop was minus-9. Given his speed and arm strength, wherever Cruz plays, this cannot continue to happen. For all that athletic ability and offensive output, to this point he’d have produced almost as much value as a DH.
![]()
Win average: 63.6 (Last: 62.9, 28th)
In the playoffs: 0.1% (Last: 0.4%)
Champions: 0.0% (Last: 0.0%)
What must change: Sandy Alcantara‘s command
It’s great to have Alcantara back after Tommy John surgery. But so far, he has been a little tough to watch. It’s often said that command lags behind stuff for many surgery returnees, and that certainly seems to be the case for the 2022 NL Cy Young winner. His walk ratio (5.9 per nine innings) is more than double his career norm and his strikeout rate (15.8%) is the lowest of his career. Alcantara threw strikes nearly 69% of the time during the three years before he was injured; this season he’s at 62%. His velocity isn’t quite all the way back either, but he’s still averaging 97.4 mph with his fastball. He’s just not putting it where it needs to be.
![]()
Win average: 54.9 (Last: 54.1, 30th)
In the playoffs: 0.0% (Last: 0.0%)
Champions: 0.0% (Last: 0.0%)
What must change: Fan patience
To paraphrase Timothée Chalamet, now ain’t the time for your tears, Sox fans. That was last year. The White Sox are the team nearest to me — less than two miles from my keyboard — so I get a good sampling of fan feedback as I get out and about, plus plenty from the local media. This isn’t a scientifically-informed observation, but it feels as if many are missing the point. The White Sox tore the team down to the studs — last year — and this is the aftermath. The bounce-back was never going to be immediate. This year’s team stinks, sure, but it’s playing a much better brand of baseball than it did last year. There are players on the roster now who might be around for awhile and more are on the way. The rebuild isn’t even 20% complete and another 100-plus losses is a near certainty, but things are better. They had to be. Watching a team come together required patience, but it’s better than what White Sox fans dealt with a year ago.
![]()
Win average: 44.6 (Last: 57.1, 29th)
In the playoffs: 0.0% (Last: 0.1%)
Champions: 0.0% (Last: 0.0%)
What must change: Everything
The Rockies’ saves leader (Zach Agnos with two) has struck out one of the 26 batters he has faced. Their wins leader (Chase Dollander, a legitimately exciting prospect) has a 6.48 ERA. The team OPS+ is 62. Their leader in plate appearances (Ryan McMahon with 136) has an OPS of .574. Did the Rockies tear down? If so, how long have they been rebuilding? It’s really hard to make sense of the last half-decade or so of this franchise, and at this point, there seems to be no relief on the horizon. They did change hitting coaches.

NEW YORK — Never were the questions of Aaron Judge‘s fitness for October particularly fair, but that’s life for the biggest man in the biggest city whose biggest failures had come at the biggest times. The burden of greatness is heavy. The burden of greatness in New York is planetary. And for those unleashing screeds on Judge’s postseasons — on hot take shows and sports-talk radio and in bars and at family dinners and everywhere, really, that anyone talks about the Yankees — it was never about whether they were fair. After all, his performances had been undeniably foul.
Judge never paid any of this any mind because he does not wire himself to do so. He cares about winning. He cares about success. He cares more than anyone who criticizes him, mocks him, derides him, leans into his past performances as if they’re predictive of an unknowable future. Judge always separated those struggles, not just because he needed to but because it is how he lives, purposely boring and boringly purposeful. He believed the moment would present itself and he would meet it. And why wouldn’t he think that? Every other endeavor in his baseball life had treated him that way.
Regardless of how the American League Division Series between the Yankees and Toronto Blue Jays breaks, what Judge did Tuesday night was the sort of thing that should put to rest questions about his October aptitude. It won’t, because it never could, but the wide-eyed, wonderstruck, childlike gawking of everyone in the Yankees’ clubhouse told the story of Tuesday night’s season-saving 9-6 victory against the Blue Jays in which Judge left jaws agape.
Poor Louis Varland. The right-handed reliever entered in the fourth inning to protect the Blue Jays’ 6-3 advantage in a game that could have clinched their spot in the AL Championship Series. He fooled Judge on a 90 mph curveball and then blew a 100 mph fastball by him and then threw another fastball at 100, up and in. Like, really in. Like, 5.9 inches off the inner corner of the plate, at triple digits, with tremendous carry, an absolute nightmare of a pitch for any hitter at any time in the game’s history to touch, let alone punish.
Nearly 400 feet later, when the ball banged off the left-field foul pole — the one place in Judge’s world where something foul is indeed fair — no one on the field could believe it. The absurdity of it all — manipulating his 6-foot-7, 282-pound body to so thoroughly alter his standard bat path, turn on 100 and keep it fair — was not lost on Varland, the Yankees who kept watching replays of the swing in the dugout, or the 47,399 at Yankee Stadium who bore witness.
“He made a really good pitch look really bad,” Varland said.
All postseason, Judge has been doing that. His 11 playoff hits lead MLB. For all of the ugliness of striking out with the bases loaded in Game 1 of this ALDS, his at-bats have been competitive all October. What he did to Varland was the culmination, precisely what the Yankees needed to see another day.
“You could feel it like in your bones,” Yankees reliever Tim Hill said. “It was crazy. It was amazing. I mean, just the pitch that he hit. All that. I’m sure my guy over there on the other side is questioning everything.”
Yes, pitching to Aaron Judge is the sort of thing of which existential crises are made. Before Tuesday, he had never hit a pitch 100 mph or faster for a home run. He hit 53 home runs this season — and none on a pitch outside the rulebook strike zone. Before Tuesday, the Blue Jays were 39-0 this season in games during which they led by at least five runs, too.
It’s impossible to overstate how out of character this was for Judge. He prides himself on good swing decisions because he knows how important they are. On pitches in the strike zone this season, Judge batted .400, 40 points higher than the next-best hitter. He slugged .867, 115 points higher than Shohei Ohtani. In his 214 plate appearances this year that ended on pitches outside of the rulebook zone, Judge batted .109 and drove in one run. All year. He didn’t have a single extra-base hit on such pitches.
One of the biggest home runs in the career of a two-time MVP favored to win a third this year was on something he never does. And if a willingness to exit his comfort zone and in the process do something that few in the history of baseball would be physically capable of doing doesn’t show that Judge isn’t just capable of success in October but destined for it, well, nothing would. And that’s fine with him. He knows emotion is the fuel that feeds the prognostications of inevitable letdown, not consistency or logic.
“I get yelled at for swinging at them out of the zone, but now I’m getting praised for it,” Judge said. “It’s a game. You’ve got to go out there and play. I don’t care what the numbers say or where something was at. I’m just up there trying to put a good swing on a good pitch, and it looked good to me.”
Inside the Yankees’ clubhouse, they’ve been yearning for Judge to have a game like this, to further validate their unflinching belief in him. The past is indisputable. Judge’s postseason OPS is more than 250 points lower than during the regular season. The Yankees haven’t won a championship during his 10 years in the big leagues. It’s real, and it’s regrettable, and it’s part of his legacy. It is also not the ink with which the future is written, which is why Aaron Boone, the Yankees’ manager with whom Judge is extremely close, said: “I don’t worry about Aaron and his state, even understanding all the outside noise.”
From Boone’s perch atop the dugout, he had the perfect view of the left-field foul pole. As the ball carried through the night, Judge stood near home plate. He didn’t pull a Carlton Fisk, trying to wave it fair. He just waited for it to land.
And when it did, helping raise his batting average this postseason to .500 and his OPS to 1.304 — nearly 300 points better than his career regular-season OPS, for the record — Judge uncorked a mini-bat flip and started his jog around the bases. When he got back to the dugout, teammates lined up and greeted him with a full high-five line.
“He’s the real deal, and as beloved a player as I’ve ever been around by his teammates,” Boone said. “They all admire him, look up to him, respect him, want his approval, and that’s just a credit to who Aaron is and how he goes about things.”
After slapping the last hand, Judge took one more step toward the end of the dugout. There awaited a television camera. Judge looked at it, pointed and turned around. He then pirouetted back and gave the audience one more stare. This was not an accident. Nothing Judge does is. It was a message, a reminder, a siren for everyone that didn’t believe.
The Yankees were still alive. And as long as that’s the case, he plans on carrying them. Even in October.


-
Greg Wyshynski
NEW YORK — Mike Sullivan coached the Pittsburgh Penguins for 10 seasons, leading them to two Stanley Cup championships. On Tuesday night at Madison Square Garden, he watched them ruin his debut as the New York Rangers‘ latest head coach.
Sullivan admitted it was a peculiar feeling having Sidney Crosby, Evgeni Malkin, Kris Letang and others he coached in Pittsburgh suddenly become his opponents.
“I mean, obviously it’s different. It’s different. I knew that was going to be the case,” he said after Pittsburgh’s 3-0 victory on the opening night of the 2025-26 NHL season. “But I’m excited about the group we have here in front of me with the Rangers. I’m looking forward to working with this group.”
The Rangers were shut out by goalie Arturs Silovs (22 saves) and watched forward Justin Brazeau score two goals in the Penguins’ win. They were outshot 15-5 in the third period and couldn’t muster anything consistent offensively in Sullivan’s debut.
“Well, I think my first observation is we got a long way to go to become the team we want to become. Some of it I think we can iron out, but certainly we’ve got a ways to go,” said Sullivan, who will coach Team USA in the 2026 Winter Olympic men’s hockey tournament in Italy. “I’m not going to overreact to it. It’s one game. We’ve got a lot of hockey to play,” he said. “So is it disappointing? Yeah. We’re going to see what we can take from it. We’ve got to move on.”
Sullivan and the Penguins agreed to part ways in April despite his being under contract through the 2026-27 season. Hired in 2015-16, Sullivan was the franchise’s most successful coach with 409 wins, only the 14th coach in NHL history to win 400 games with one team. Pittsburgh won back-to-back Stanley Cups in 2016 and 2017 with Sullivan.
Days later, after he left the Penguins, Sullivan was hired by the Rangers to replace coach Peter Laviolette, signing a five-year contract that made him the NHL’s highest-paid coach. Sullivan, 57, had previously served as an assistant coach with New York from 2009 to 2013, during which time he coached Rangers GM Chris Drury as a player.
Penguins captain Crosby acknowledged it was a different feeling having Sullivan behind the Rangers’ bench instead of his.
“I just go out there and compete, but it’s always weird that first little bit,” he said.
For Crosby, it wasn’t just seeing Sullivan coaching the opponents. Sullivan brought former Penguins assistants David Quinn and Ty Hennes with him to New York.
While Sullivan took the loss against his former team, new Penguins coach Dan Muse earned a victory against his. Muse was an assistant coach under Laviolette for two seasons in New York and reportedly interviewed for the vacancy before Sullivan was hired. Crosby was happy to get Muse the win.
“Every team will tell you, especially early in the season, it’s not going to be perfect. You’re just trying to be on the same page as much as possible. And I feel like he prepared us well to start the year,” Crosby said.
Pittsburgh had Crosby, Malkin and Letang in its starting lineup, three players who have been on the Penguins team together since 2007.
“We had three guys that have been playing together for 20 years, and I thought it was important that they get to start the game together,” Muse said.


-
Alden Gonzalez
LOS ANGELES — Roki Sasaki hasn’t been officially declared the closer, but he might as well be. Los Angeles Dodgers manager Dave Roberts said Tuesday that Sasaki is “definitely the primary option now” in the ninth inning, but that is also contingent on his workload.
“We have to win X amount of games [to secure a championship], and he’s not going to close every game,” Roberts said before Tuesday’s workout from Dodger Stadium. “It’s just not feasible, so, you’ve got to use other guys.”
Roberts attempted to do that in Game 2 of the National League Division Series on Monday night, deploying Blake Treinen with a three-run lead in the ninth inning. But Treinen allowed the first three batters to reach, cutting the Philadelphia Phillies‘ deficit to a single run. Alex Vesia followed by facing three batters, retiring two. Sasaki then entered the game and recorded the final out in what amounted to his fifth major league relief appearance since transitioning to the bullpen in mid-September.
The Dodgers entered the postseason with a leaky bullpen they hoped to shore up with starting pitchers, most notably Sasaki but also Emmet Sheehan, Clayton Kershaw and, at times, Tyler Glasnow. The likes of Treinen, Tanner Scott, Kirby Yates and Michael Kopech — the latter two currently recovering from injuries but expected to be available for a potential National League Championship Series — were expected to anchor a dominant bullpen. All of them, to varying degrees, have fallen out of favor, but Roberts will inevitably have to trust them again at some point.
“If there’s a world where you can use five pitchers and finish a postseason and win the postseason, I think a lot of people would sign up for that,” Roberts said. “But that’s impossible. So you’ve got to use your roster at certain times and kind of pick spots where you feel best and live with whatever outcome. But that’s just the way it goes to win, for us, 13 games in October.”
In hopes of winning at least one, the Phillies, coming off back-to-back losses in Philadelphia, will turn to veteran right-hander Aaron Nola with their season on the line in Game 3 on Wednesday. Nola, 32, navigated a career-worst year in 2025, going 5-10 with a 6.01 ERA. But Phillies manager Rob Thomson will deploy lefty starter Ranger Suarez behind Nola, with Cristopher Sanchez fully rested for a potential Game 4.
Thomson said he went with Nola because of Nola’s strong finish to the regular season — eight innings of one-run ball against the Minnesota Twins — and because Nola is more comfortable starting than coming out of the bullpen. A lefty is typically a better option against the top of the Dodgers’ lineup, but the left-handed-hitting Shohei Ohtani and Freddie Freeman have combined for a 1.056 OPS against Suarez.
“I have trust in both of them, don’t get me wrong,” Thomson said. “But Nola has pitched in some really big games for us in the last couple of years.”
Thomson said center fielder Harrison Bader, who suffered a hamstring strain in Game 1, will be a “game-time decision” on Wednesday. Bader pinch hit in the ninth inning of Game 2 and was replaced by a pinch runner after his single. Starting him as the designated hitter and putting Kyle Schwarber in the outfield is not an option.
“He’s still got to run,” Thomson said of Bader. “If he can run, he’s going to play center field.”
Dodgers catcher Will Smith, nursing a hairline fracture in his right hand, has not started any of the team’s four playoff games but has caught the final innings in each of the first two games of this series. Doing so again in Game 3 makes sense, given that the Dodgers would have the platoon advantage by starting the left-handed-hitting Ben Rortvedt against Nola and later turning to the right-handed-hitting Smith against Suarez. But Roberts said “there is hope” of Smith catching the whole game.
“I’ll make the decision tomorrow,” Roberts said. “Each day, it’s gotten better, so I feel more confident that he’ll be able to start.”
-
 Sports3 years ago
‘Storybook stuff’: Inside the night Bryce Harper sent the Phillies to the World Series
-
 Sports2 years ago
Story injured on diving stop, exits Red Sox game
-
 Sports2 years ago
Game 1 of WS least-watched in recorded history
-
 Sports3 years ago
Button battles heat exhaustion in NASCAR debut
-
 Sports3 years ago
MLB Rank 2023: Ranking baseball’s top 100 players
-
Sports4 years ago
Team Europe easily wins 4th straight Laver Cup
-
 Environment2 years ago
Japan and South Korea have a lot at stake in a free and open South China Sea
-
 Environment1 year ago
Here are the best electric bikes you can buy at every price level in October 2024