

Another way electric cars clean the air: study says brake dust reduced by 83%
![]()

A new study is out which quantifies just how much EVs help not just in cutting harmful exhaust emissions, but also cutting other types of pollution that come from personal vehicles. But of course, public transport, biking and walking are even better.
We’ve seen plenty of studies showing how the benefits of shifting to EVs translate to the real world, for example in California and London, where higher EV shares and regulations aimed at cutting down the excesses of polluting vehicles have produced significant air quality benefits already.
As it has become more and more untenable for anti-EV propagandists to deny the air quality benefits of EVs, a common refrain from them has become “but tailpipe emissions aren’t everything, what about brakes and tires, huh?!”
Putting aside for the moment the clear concern trolling involved in this response, it’s always been easy enough to point to regenerative braking as a reason that EVs improve that problem too – since they rarely use the brakes, they obviously wouldn’t emit as many brake particles.
But now we have proper quantification of that, and not only is the reduction in brake dust from battery-electric vehicles (BEVs) quite high, its also much higher than the benefit gained from either conventional gas-only hybrids or plug-in hybrids (PHEVs).
The analysis looked at various “non-exhaust emissions” of road transport, recognizing that as car exhaust becomes cleaner due to greater fleet electrification, other forms of emissions will end up taking over as the dominant pollutants from road transport.
It turns out that BEVs reduce the amount of brake dust by 83%, according to a new analysis by EIT Urban Mobility (a body of the European Union) and Transport for London. The study looked primarily at London, Milan and Barcelona.
The primary reason for this is the use of regenerative braking, meaning that electric vehicles can slow down without rubbing friction brakes. Other vehicles that use regenerative braking reduced brake emissions too, with Hybrids reducing them by 10-48%, and PHEVs by 66%.
Other forms of non-exhaust emissions also analyzed
The analysis looked at other forms of pollution as well, from tire and road wear.
On tire wear, the study assumed that BEVs would be responsible for more tire wear due to their greater weight. The study claims that BEVs are about 20% heavier than gas cars – though much of this is attributable to a vehicle mix that is more focused on larger vehicles, as it seems like every EV manufacturer is making huge SUVs and few are making small cars (a trend that can be seen in gas cars as well, which are 21% heavier than they were 20 years ago, and new EVs are more highly represented at the culmination of this trend).
When looking side-by-side at the best purpose-built EVs and their gas-powered counterparts, such as the Tesla Model 3 and the BMW 3 series, there is little difference in weight (the Tesla is only about ~200lbs heavier, across the model line, a difference of about 5%, not 20%).
Despite the slightly higher levels of tire wear from EVs, brake dust was found to be more unhealthy, as brake dust is much more likely to become airborne (>40%) than tire wear is (1-5%). So EVs create a lot less of the worse thing, and a little more of the less-bad thing.
Even using the study’s 20% number for EV. vs. gas car weight, this doesn’t handicap EVs much. BEVs produce 38% less total brake, road and tire wear combined, without even taking into account their exhaust benefits.

The analysis includes an interactive modeling tool where you can examine different types of transport and the amount of emissions they produce, with electric models being the clear winner out of the various analyzed powertrains.
We plugged in a few numbers and taking into account every form of emissions – brakes, tires, road wear and exhaust – electric cars even fared nearly as well as gas-powered motorcycles. While an individual EV does still produce 57% more total emissions than a gas-powered motorcycle per mile, as long as that car has higher occupancy than the motorcycle, that means it could fare better in terms of emissions per person-mile.
Shifting away from private cars is even better
The mention of person-miles brings up another answer for these problems: “mode shifting,” or moving drivers from cars to other methods of transport.
Buses and other heavy vehicles are accounted for in the tool, and they’ve got bigger numbers, but that doesn’t actually mean they’re dirtier.
While buses are obviously responsible for more emissions than cars individually, once you take into account the number of people they carry, that number plummets significantly. Buses may be responsible for ~4-5 times as many non-exhaust emissions as cars per mile, but a bus can hold an order of magnitude more people than a car can, reducing both emissions and traffic congestion.
And, just as was the case with electric cars, electric buses perform significantly better in terms of total emissions than gas buses do.
Beyond that, you get down to the absolute best answers: walking and biking. These two methods produce negligible environmental impact, and the study recommends that cities focus on encouraging these forms of transport wherever possible.
Luckily, we here at Electrek also love to cover electric bikes, which are a great way to get around that still offers the health and environmental benefits of cycling, but reduce the annoyances you might get from hills or windy days.
Study recommendations
Taking all this information together, the study makes some recommendations. It obviously points out that fleet electrification will be beneficial in reducing non-exhaust emissions, and suggests that that should continue rapidly.
However, it also points out that the total reduction in non-exhaust emissions from shifting drivers to public transport, rather than individual vehicles, can be 5x higher than just electrifying the vehicle fleet alone. So shifting drivers to using public transport should be prioritized when possible. Or, getting people to walk or bike instead.
For those vehicles that do remain on the road, lower-wear products can be encouraged, like carbon composite brake discs or those coated with hard metal coatings. Similarly, some tires are more wear-resistant than others, and there is little regulation forcing focus on lower-wear tire technologies.
Governments should also work to reverse ballooning vehicle sizes and higher SUV share for private vehicles (where have we heard that before…).
One great way to ensure your EV is as low-polluting as possible is to charge your electric vehicle at home using rooftop solar panels. Find a reliable and competitively priced solar installer near you on EnergySage, for free. They have pre-vetted installers competing for your business, ensuring high-quality solutions and 20-30% savings. It’s free, with no sales calls until you choose an installer. Compare personalized solar quotes online and receive guidance from unbiased Energy Advisers. Get started here. – ad*
FTC: We use income earning auto affiliate links. More.


It’s October 1st, which means the $7,500 Federal EV tax credit is dead and gone. That doesn’t mean it’s the end of the road for EVs, however – BMW, Ford, GM, and others are stepping up with big rebates, clever accounting tricks, and huge discounts to keep the deals rolling! All this and more on today’s stylin’, profilin’, limousine-riding, jet flying, kiss-stealing, wheelin’ n’ dealin’ episode of Quick Charge!
WOOOOOOOOO!!!
We’ve also got a hard-hitting look at both the EV and oil subsidies impacting the auto market at large, and what it means to give these two different technologies a level playing field to compete for customers on.
Today’s episode is brought to you by Climate XChange, a nonpartisan, nonprofit organization working to help states pass effective, equitable climate policies. The nonprofit just kicked off its 10th annual EV raffle, where participants have multiple opportunities to win their dream EV.
Visit CarbonRaffle.org/Electrek to learn more!
Source Links
Prefer listening to your podcasts? Audio-only versions of Quick Charge are now available on Apple Podcasts, Spotify, TuneIn, and our RSS feed for Overcast and other podcast players.
New episodes of Quick Charge are recorded, usually, Monday through Thursday (most weeks, anyway). We’ll be posting bonus audio content from time to time as well, so be sure to follow and subscribe so you don’t miss a minute of Electrek’s high-voltage daily news.
Got news? Let us know!
Drop us a line at tips@electrek.co. You can also rate us on Apple Podcasts and Spotify, or recommend us in Overcast to help more people discover the show.
If you’re considering going solar, it’s always a good idea to get quotes from a few installers. To make sure you find a trusted, reliable solar installer near you that offers competitive pricing, check out EnergySage, a free service that makes it easy for you to go solar. It has hundreds of pre-vetted solar installers competing for your business, ensuring you get high-quality solutions and save 20-30% compared to going it alone. Plus, it’s free to use, and you won’t get sales calls until you select an installer and share your phone number with them.
Your personalized solar quotes are easy to compare online and you’ll get access to unbiased Energy Advisors to help you every step of the way. Get started here.
FTC: We use income earning auto affiliate links. More.


Solar and wind accounted for 90% of new US electrical generating capacity added in the first seven months of 2025, according to data just released by the Federal Energy Regulatory Commission (FERC). In July, solar alone provided 96% of new capacity, making it the 23rd consecutive month solar has held the lead among all energy sources.
Solar’s new generating capacity in July and YTD
In its latest monthly “Energy Infrastructure Update” report (with data through July 31, 2025), which was reviewed by the SUN DAY Campaign, FERC says 46 “units” of solar totaling 1,181 megawatts (MW) were placed into service in July, accounting for over 96.4% of all new generating capacity added during the month.
The 434 units of utility-scale (>1 MW) solar added during the first seven months of 2025 total 16,050 MW and were 74.4% of the total new capacity placed into service by all sources.
Solar has now been the largest source of new generating capacity added each month for 23 consecutive months from September 2023 to July 2025. During that period, total utility-scale solar capacity grew from 91.82 gigawatts (GW) to 153.09 GW. No other energy source added anything close to that amount of new capacity. Wind, for example, expanded by 10.68 GW, while natural gas increased by just 3.74 GW.
Renewables were 90% of new capacity added YTD
Between January and July, new wind provided 3,288 MW of capacity additions – significantly more than the new capacity provided by natural gas (2,207 MW). Wind thus accounted for 15.2% of all new capacity added during the first seven months of 2025.
For the same period, the combination of solar and wind (plus 4 MW of hydropower and 3 MW of biomass) was 89.6% of new capacity, while natural gas provided just 10.2%; the balance came from coal (18 MW), oil (17 MW), and waste heat (17 MW).
Solar + wind are 23.23% of US utility-scale generating capacity
Utility-scale solar’s share of total installed capacity (11.42%) is now almost equal to that of wind (11.81%). Taken together, they constitute 23.23% of the US’s total available installed utility-scale generating capacity.
Moreover, at least 25-30% of US solar capacity is in the form of small-scale (e.g., rooftop) systems that are not reflected in FERC’s data. Including that additional solar capacity would bring the share provided by solar + wind to more than a quarter of the US total.
With the inclusion of hydropower (7.61%), biomass (1.07%), and geothermal (0.31%), renewables currently claim a 32.22% share of total US utility-scale generating capacity. If small-scale solar capacity is included, renewables are now more than one-third of total US generating capacity.
Solar still on track to become No. 2 source of US generating capacity
FERC reports that net “high probability” additions of solar between August 2025 and July 2028 total 92,631 MW – an amount more than four times the forecast net “high probability” additions for wind (22,528 MW), the second fastest-growing resource.
FERC also foresees net growth for hydropower (579 MW) and geothermal (92 MW) but a decrease of 131 MW in biomass capacity.
Taken together, the net new “high probability” capacity additions by all renewable energy sources over the next three years – the bulk of the Trump Administration’s remaining time in office – would total 115,120 MW.
There are now 35 MW of new nuclear capacity in FERC’s three-year forecast, while coal and oil are projected to contract by 25,017 MW and 1,576 MW, respectively. Natural gas capacity would expand by just 8,276 MW.
Should FERC’s three-year forecast materialize, by mid-summer 2028, utility-scale solar would account for more than 17% of installed U.S. generating capacity – more than any other source besides natural gas (40%). Further, the capacity of the mix of all utility-scale renewable energy sources would exceed 38%. Inclusion of small-scale solar systems would push renewables ahead of natural gas.
“With one month of Trump’s ‘One Big Beautiful Bill’ now under our belts, renewables continue to dominate capacity additions,” noted the SUN DAY Campaign’s executive director, Ken Bossong. “And solar seems poised to hold its lead in the months and years to come.”

The 30% federal solar tax credit is ending this year. If you’ve ever considered going solar, now’s the time to act. To make sure you find a trusted, reliable solar installer near you that offers competitive pricing, check out EnergySage, a free service that makes it easy for you to go solar. It has hundreds of pre-vetted solar installers competing for your business, ensuring you get high-quality solutions and save 20-30% compared to going it alone. Plus, it’s free to use, and you won’t get sales calls until you select an installer and share your phone number with them.
Your personalized solar quotes are easy to compare online and you’ll get access to unbiased Energy Advisors to help you every step of the way. Get started here.
FTC: We use income earning auto affiliate links. More.

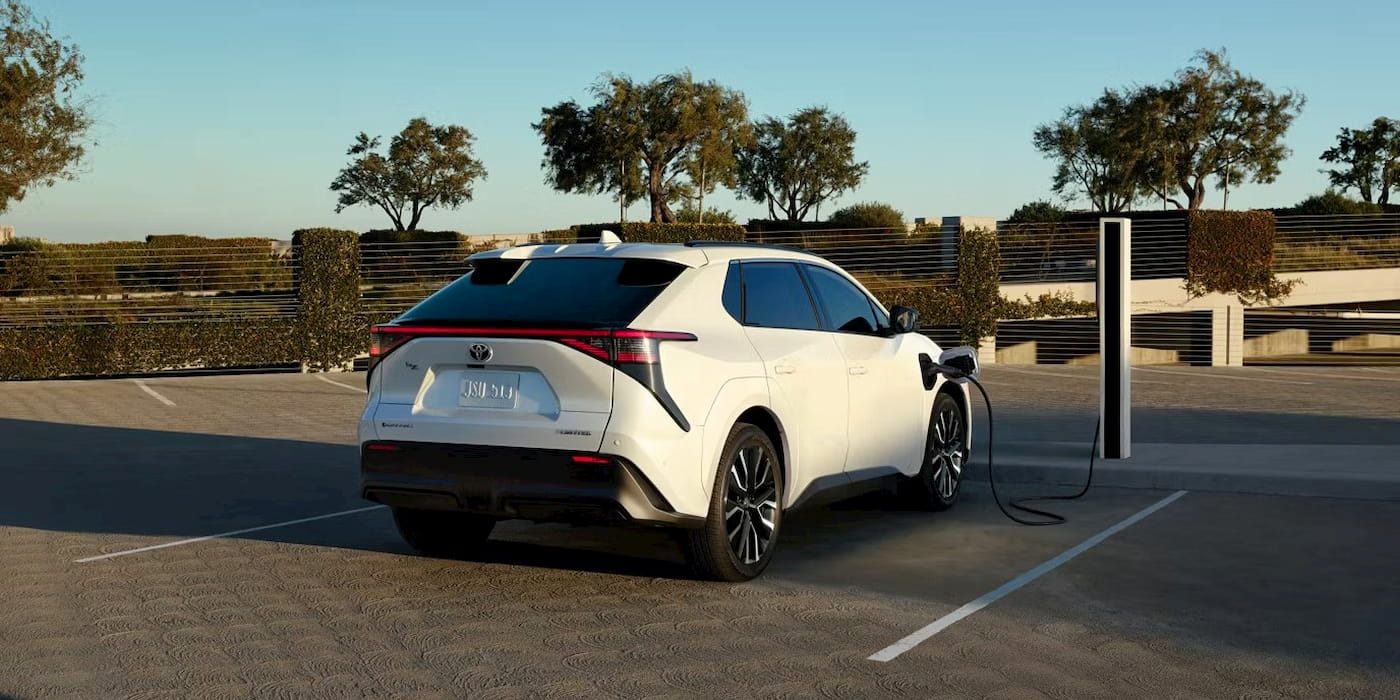
Toyota’s electric vehicle sales plunged as it prepares for a new wave of models. The new EVs are bringing much-needed upgrades, including more range, faster charging, revamped designs, and more.
Toyota’s EV sales crashed in Q3 as new models roll out
Despite most automakers reporting record EV sales as buyers rushed to claim the $7,500 federal tax credit, Toyota was an outlier, selling just 61 BZ models in September.
Including the Lexus RZ, which managed 86 sales, Toyota sold just 147 all-electric vehicles in the US last month, over 90% less than the 1,847 it sold in September 2024.
Toyota’s total sales were up 14% with over 185,700 vehicles sold, meaning EVs accounted for less than 0.1%. Through the first nine months of the year, sales of the BZ and Lexus RZ are down 9% and 36% compared to the year prior.
So, why is Toyota struggling to sell EVs when the market is booming? For one, it’s basically sold out of its current EV models, the bZ4X and Lexus RZ.
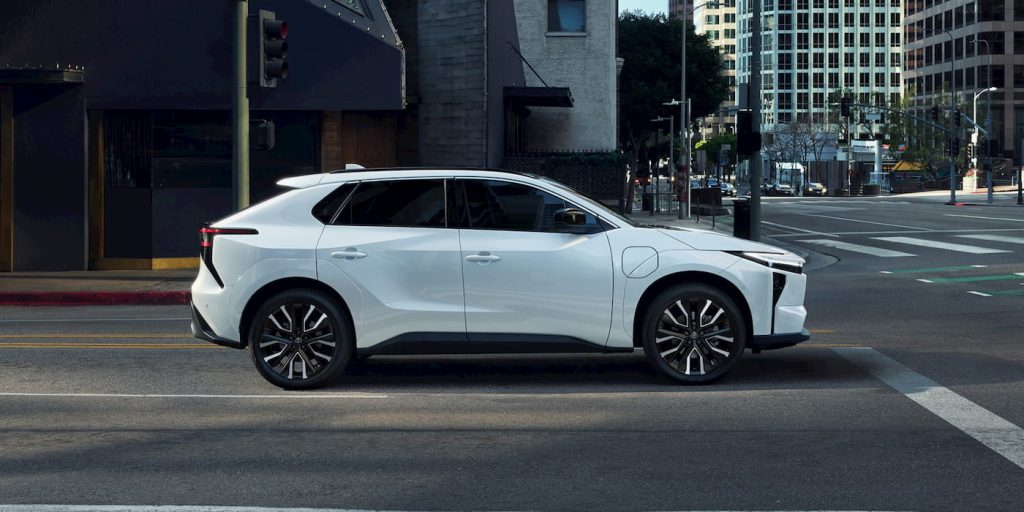
The 2026 Toyota BZ (formerly the bZ4X) is arriving at US dealerships, promising to fix some of the biggest complaints with the outgoing electric SUV.
Powered by a larger 74.7 kWh battery, the 2026 Toyota BZ offers up to 314 miles of driving range, a 25% improvement from the 2025 bZ4X.

The electric SUV features Toyota’s new “hammerhead front end” design, similar to that of the new Crown and Camry, with a slim LED light bar and revamped front fascia.
Toyota’s new electric SUV also features a built-in NACS charge port, allowing for recharging at Tesla Superchargers. It also features a new thermal management system and battery preconditioning, which improves charge times from 10% to 80% in about 30 minutes.

The base 2026 BZ XLE FWD starts at just $34,900, but uses a smaller 57.7 kWh battery, good for 236 miles range.
The 2026 Lexus RZ received similar updates. Next year, Toyota is launching two more fully electric SUVs, the 2026 C-HR and BZ Woodland.
| 2026 Toyota bZ trim | Battery | Range | Starting Price* |
| XLE FWD | 57.7 kWh | 236 miles | $34,900 |
| XLE FWD Plus | 74.7 kWh | 314 miles | $37,900 |
| XLE AWD | 74.7 kWh | 288 miles | $39,900 |
| Limited FWD | 74.7 kWh | 299 miles | $43,300 |
| Limited AWD | 74.7 kWh | 278 miles | $45,300 |
It’s not just the US that Toyota’s EV sales crashed last month, either. In its home market of Japan, Toyota (including Lexus) sold just 18 EVs in September.
The Japanese auto giant is betting on new models to drive growth. However, it remains committed to offering all powertrain options, including battery electric vehicles (BEVs), hybrids, plug-in hybrid electric vehicles (PHEVs), and fuel cell electric vehicles (FCEVs).
Can Toyota’s new generation of electric vehicles spark a comeback? Let us know your thoughts in the comments.
FTC: We use income earning auto affiliate links. More.
-
 Sports3 years ago
‘Storybook stuff’: Inside the night Bryce Harper sent the Phillies to the World Series
-
 Sports1 year ago
Story injured on diving stop, exits Red Sox game
-
 Sports2 years ago
Game 1 of WS least-watched in recorded history
-
 Sports3 years ago
Button battles heat exhaustion in NASCAR debut
-
 Sports3 years ago
MLB Rank 2023: Ranking baseball’s top 100 players
-
Sports4 years ago
Team Europe easily wins 4th straight Laver Cup
-
 Environment2 years ago
Japan and South Korea have a lot at stake in a free and open South China Sea
-
 Environment12 months ago
Here are the best electric bikes you can buy at every price level in October 2024