


CHARLOTTE, N.C. — The landmark federal antitrust trial against NASCAR opened Monday with three-time Daytona 500 winner Denny Hamlin breaking down in tears minutes into his testimony as the first witness in a case that could upend the venerable stock car series.
Hamlin’s 23XI Racing, which he co-owns with Michael Jordan, and Front Row Motorsports claim the series is a monopolistic bully that leaves its teams no option but to comply with rules and financing they don’t agree with.
As Jordan watched from the gallery, Hamlin began to cry and had to stop and compose himself when asked how he got into racing. He disclosed to The Associated Press last month that his father is dying, and he said on the stand he was emotional because his dad “is not in great health.”
“We got to when I was about 20 and a decision had to be made, I could keep racing or go out and work for my dad’s trailer business,” Hamlin testified, adding that he later was thinking about what retirement looked like and found a team going out of business. He needed a partner and turned to Jordan, who he had developed a friendship with when the Basketball Hall of Famer owned the Charlotte Hornets and Hamlin was a season-ticket holder.
“If I can’t be successful with Michael as a partner, I knew this was never going to work,” he said.
The references to his early days in auto racing and the sacrifices his family made were intended to show how difficult it is for both team owners and drivers to make it at the top level of the sport. He said he never would have been able to start 23XI in 2021 had he not partnered with Jordan.
Because of Jordan’s presence with the team, Hamlin testified, 23XI has turned a profit in all but one of its five seasons of operation. His attorney, Jeffrey Kessler, said in his opening statement that fast-food restaurant entrepreneur Bob Jenkins has never turned a profit since starting his Front Row team in 2004, a team that won the Daytona 500 in 2021.
Kessler said a NASCAR-commissioned study found that 75% of teams lost money in 2024 and added that over a three-year period almost $400 million was paid to the France Family Trust. He said a 2023 evaluation by Goldman Sachs found NASCAR to be worth $5 billion. NASCAR is currently run by Jim France, son of founder Bill France Sr.
“What the evidence is going to show is Mr. France ran this for the benefit of his family at the expense of the teams and sport,” Kessler said.
At the heart of the lawsuit is NASCAR’s revenue sharing model, which 23XI and Front Row argue is unfair to race teams that often operate at a loss. Hamlin testified it cost $20 million to simply bring a single car to the track over a 38-race season, not including overhead expenses such as driver salary and business operations.
“So, why would these people do this if you are just going to lose money because NASCAR isn’t giving you a fair deal?” asked Kessler, “Because you love stock car racing, and there’s nowhere else to do it.”
The charter agreements signed for this year that triggered the lawsuit guarantee the teams $12.5 million in annual revenue per chartered car. NASCAR argues the guaranteed payouts are an increase from $9 million from the previous agreement, but Hamlin noted that 11 of the first 19 chartered teams are no longer in business.
All three charters 23XI purchased came from teams that ceased operations, and Hamlin said 23XI paid $4.7 million for its first charter, $13.5 million for its second and $28 million for its third, acquired late last year. He acknowledged purchasing the third charter was a risk because of the pending litigation – and the price concerned him – but it was required if 23XI intends to build itself into a top team.
The charter system guarantees a car a spot in the field each race week as well as a percentage of the purse and gives team owners an asset to sell should they want to get out of the business.
NASCAR attorneys argued that the charter system has created $1.5 billion in equity for the 36 chartered teams. Prior to the charter system, teams raced “open,” with no guarantee they’d make the field or earn a payout.
“The France family built NASCAR from nothing. They are an American success story,” Johnny Stephenson said in the opening statement for NASCAR. Stephenson is a colleague of Christopher Yates, who had previously handled most of the courtroom arguments for the defendants.
“They’ve done it through hard work over 75 years. That’s the kind of effort that doesn’t deserve a lawsuit. That’s the kind of effort that deserves admiration.”
The case has churned through hearings and arguments for more than a year despite calls from other NASCAR teams to settle. U.S. District Judge Kenneth Bell even helped mediate a failed two-day summit in October.
A NASCAR victory could put 23XI, Front Row and their six combined cars out of business. Their charters – now being held by NASCAR – would likely be sold. The last charter went for $45 million, and NASCAR has indicated there is interest from potential buyers including private equity firms.
A win for the teams could lead to monetary damages and the potential demolition of NASCAR as it is run today. The judge has the power to unravel a monopoly, and nothing is off the table, from ordering a sale of NASCAR to the dismantling of the charter system.
Jordan’s presence factors into the trial
Jordan’s presence in the courtroom gallery near Hamlin was a factor: Among those dismissed from serving on the jury was a man who said he can’t be impartial because “I like Mike” and another who said he had Michael Jordan posters on his walls growing up. A juror said they were a North Carolina fan but noted the football team at Jordan’s alma mater is not “doing too well right now” to which the star shook his head and laughed.
NASCAR executives in the courtroom included chairman Jim France and vice chair Lesa France Kennedy, two scions of the family that founded NASCAR in 1948 and still owns it.
Hamlin will resume testimony Tuesday morning. NASCAR Commissioner Steve Phelps, 23XI minority owner Curtis Polk, France Kennedy and other top executives had to leave the courtroom after opening arguments because they are all potential witnesses.
Environment
Rivian confirms new purple exterior color called ‘Borealis’ and is exploring interior scents

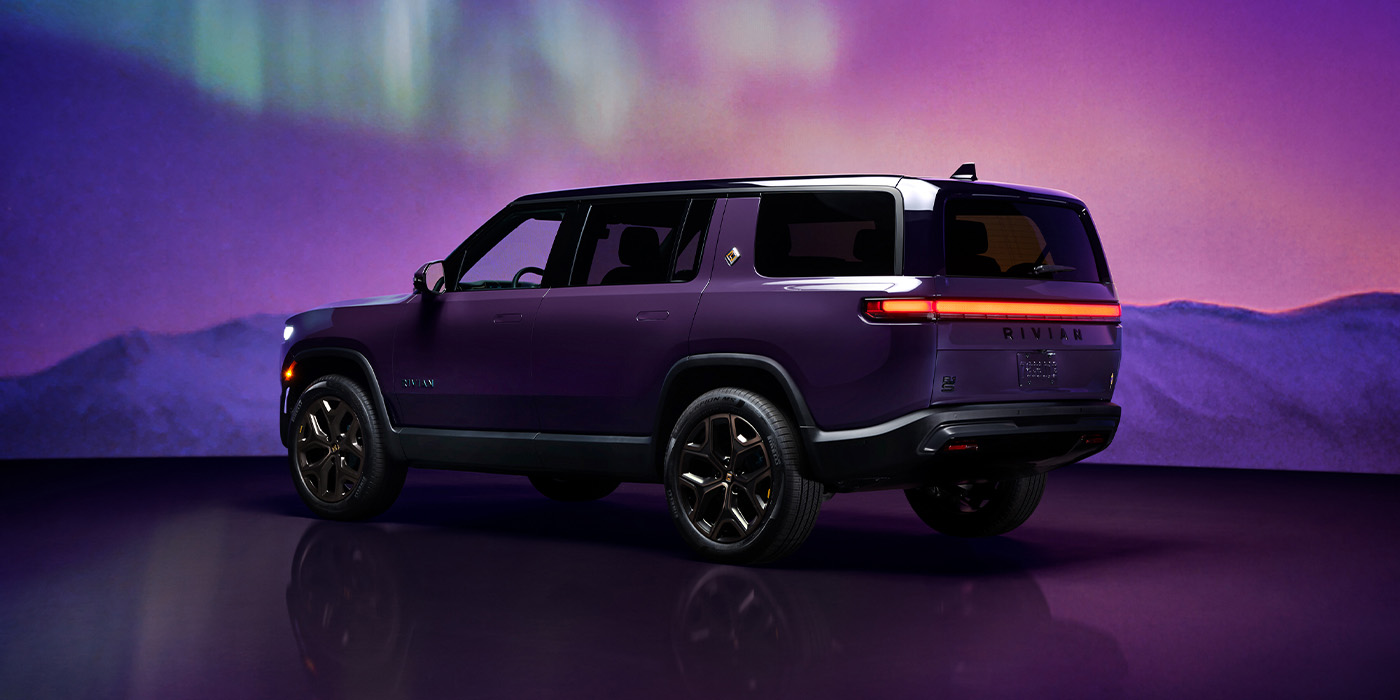
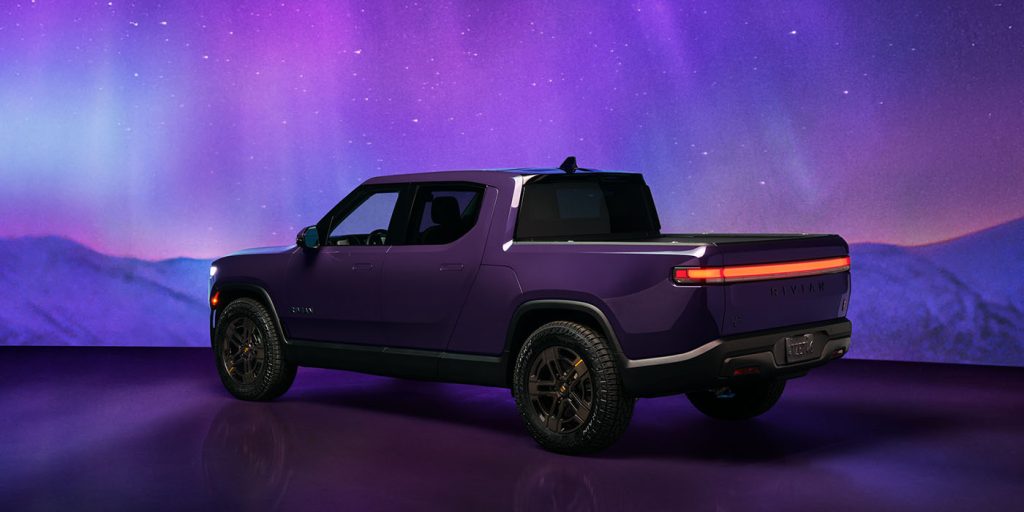
After nearly a year of speculation online, Rivian has confirmed it will begin offering a new purple exterior color, and we now have the name – Borealis. Inspired by its own community, Rivian’s latest color will be available for a limited time on select variants and arrives as part of a broader design initiative focused on sensory experiences.
Welp, Rivian is actually offering purple EVs.
We had a feeling that this news might be coming at some point, and the confirmation has been nearly a year in the making. Earlier in 2025, some Redditors in the Rivian community started posting images of what appeared to be a purple R1S Quad out in the wild.
We covered the news about 8 months later when fresh images once again emerged of the same truck and the same dealership plates. We could confirm there was at least one purple Rivian, still owned and operated by the American EV automaker, in existence.
What we could not confirm was whether the Grimace-mobile was a one-off or a hint at plans for a new exterior color option. At the time, representatives for Rivian said they could not comment on speculation, but also did not dismiss any indications that a new purple exterior could be in the works.
This morning, Rivian made its presence known at Collins Park during Art Week Miami Beach, where it has set up a multi-sensory exhibition that includes scent, touch, and, of course, the sight of the new Borealis purple exterior. Check it out.

Rivian to offer customers a purple exterior option
During Art Week Miami Beach 2025, which kicked off earlier this week, Rivian has unveiled an exhibition called “Rewilding the Future,” an “immersive exploration of the natural systems” that shape Rivian’s design process.
This multi-sensory exhibit will expose visitors to a range of experiences, including a tactile “touch” where they can create their own objects from recycled and upcycled materials. Rivian also shared that it is exploring scents and has developed one for the exhibit highlighted in The Scent of Terrain. Visitors can first deconstruct the unique scent by smelling the individual top, mid, and base notes in glass flasks before sniffing an oil that combines them all into one sensory experience. Liz Guerrero, Sr. Director of Marketing Experiences at Rivian, elaborated:
Scent is uniquely memorable and we want to get to a place where we have a scent that becomes synonymous with the Rivian brand, sparking that amazing recall that you almost don’t realize you have. This is the next step in the learning process, and we’re excited to see the response.
It is unclear whether there is a specific goal in mind for Rivian’s scent-tric “learning process,” but it could involve brand-specific aromas inside or outside its EVs. Perhaps that new car smell will be “Terrain,” or you will be able to buy some Rivian cologne next holiday season. Rivian has not confirmed any of this, although we did request more information on its plans to integrate scent into design (or not).
Last but not least, Rivian’s Miami exhibit is focused on sight – more specifically, the public debut of its new Borealis purple exterior color. Per Rivian:
This color is a dynamic, deep velvety purple that shifts with the light and captures the essence of the aurora borealis, nature’s most spectacular light show. The inspiration for Borealis came directly from our community. During a 2024 solar event, a group of Rivian owners shot photos of their vehicles glowing under the surreal, purple-washed sky and it captured our design team’s imagination. Borealis pays homage to the spirit of exploration that defines our owners and celebrates the unexpected beauty found in mother nature.
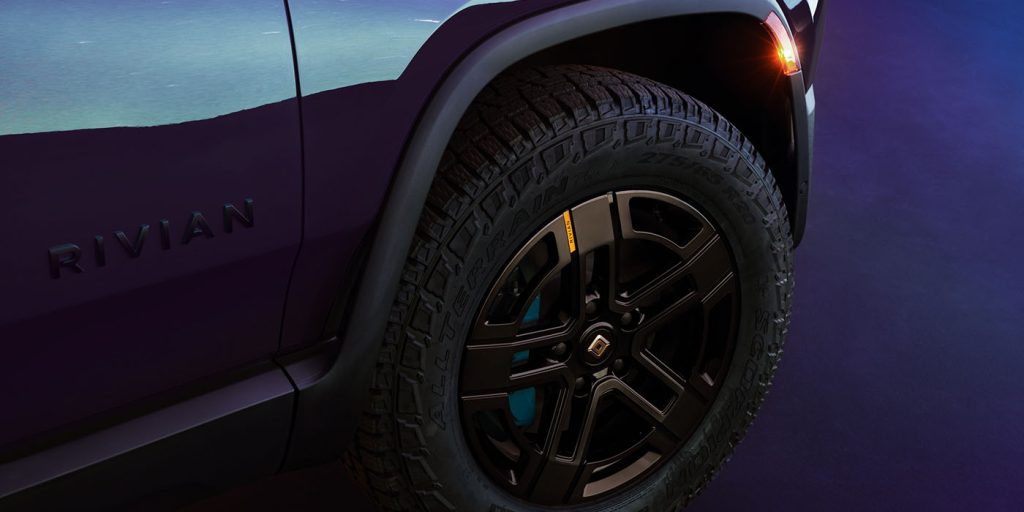
In addition to Borealis, Rivian also debuted a new 20″ All-Terrain Burnished Bronze wheel (pictured above), available exclusively on its new Quad-Motor R1 lineup. As for the purple, Rivian said it is available to customers now on Tri and Quad configurations, but only for a limited time.
The Borealis debut is just one of several color stories being told at the Rivian art exhibit, and those purple EVs will be joined by the automaker’s R1S Quad Miami Edition, which will be on display at Miami Rivian Spaces in Aventura and Brickell beginning today.
FTC: We use income earning auto affiliate links. More.
-
 Sports2 years ago
Story injured on diving stop, exits Red Sox game
-
 Sports3 years ago
‘Storybook stuff’: Inside the night Bryce Harper sent the Phillies to the World Series
-
 Sports2 years ago
Game 1 of WS least-watched in recorded history
-
 Sports3 years ago
Button battles heat exhaustion in NASCAR debut
-
 Sports3 years ago
MLB Rank 2023: Ranking baseball’s top 100 players
-
Sports4 years ago
Team Europe easily wins 4th straight Laver Cup
-
 Environment3 years ago
Japan and South Korea have a lot at stake in a free and open South China Sea
-
 Environment1 year ago
Here are the best electric bikes you can buy at every price level in October 2024