

Tesla CEO Elon Musk threw shade at Waymo for having “rookie numbers” amid Tesla’s own disappointing autonomous-driving performance, raising the question: Is Elon Musk delusional or simply lying about Tesla’s Full Self-Driving?
Every year since 2018, Musk has alternately claimed that Tesla would solve self-driving “by the end of the year” or “next year.”
It never happened.
Tesla claimed a sort of victory this year with the launch of its “Robotaxi” service in Austin, Texas, but even that has been misleading since the service only operates a few vehicles in a geofenced area, something Musk has criticized Waymo for in the past, and unlike Waymo, Tesla has in-car supervisors with a finger on a killswitch to stop the vehicle in case of a potential accident.
Even with in-car supervisors preventing an unknown number of accidents, we recently learned that Tesla’s robotaxi crash rate is almost twice that of Waymo’s, which operates its service without any employees inside its vehicles.
Now, Musk called Waymo’s 2,500 fully autonomous vehicles currently in operation “rookie numbers”:
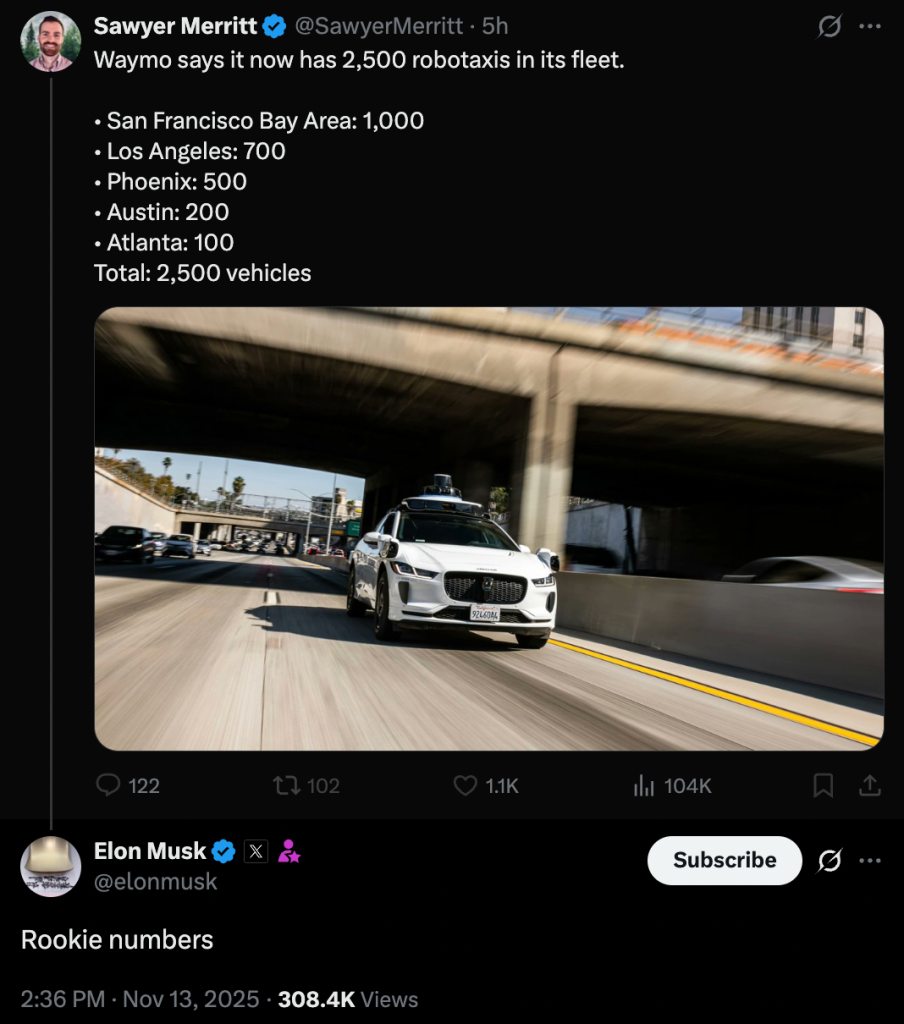
To put the comment in perspective, Tesla is believed to have about ~30 “Robotaxis” in its Austin fleet. In addition, Tesla claims to be operating “robotaxis” in the Bay Area with just over 100 cars, but it is officially considered a ride-hailing service because drivers are in the driver’s seat, and Tesla hasn’t even applied for an autonomous driving permit in California.
Tesla has also been pushing increasingly more misleading claims about its “Full Self-Driving” system being safer than humans.”
In the last few weeks, Tesla has repeatedly shared this misleading data as “proof” that its system is safer than humans:
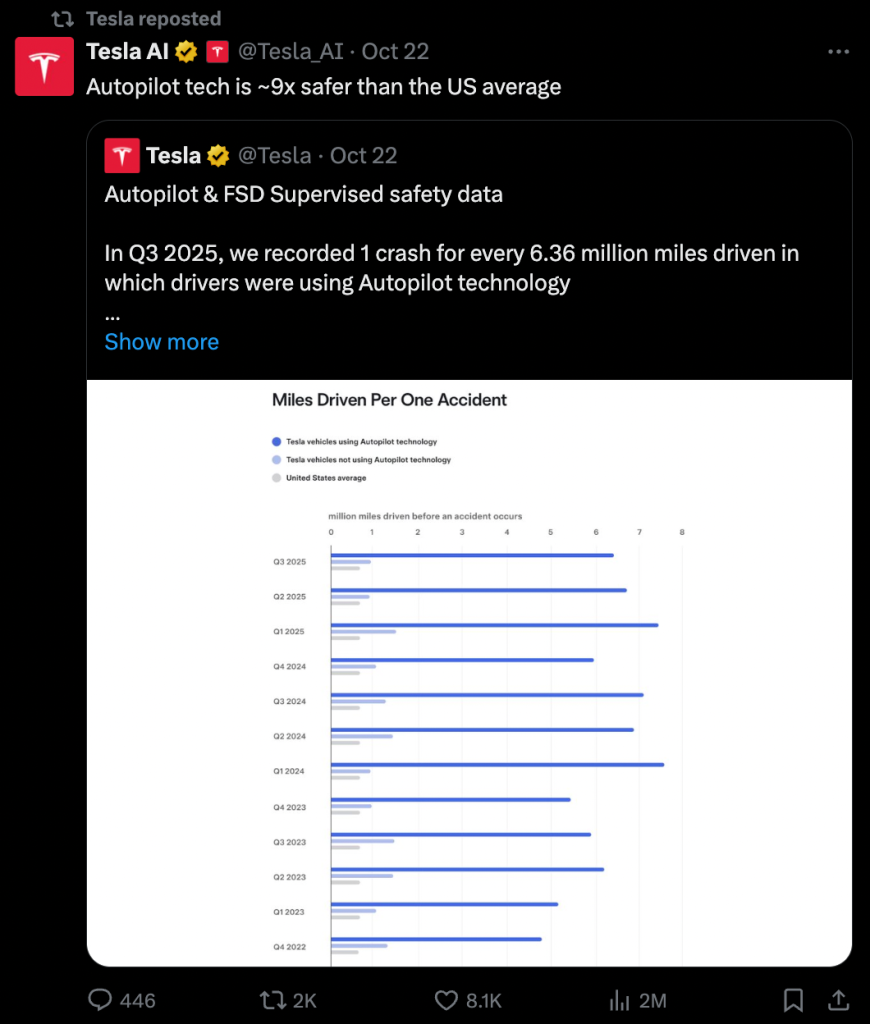
This dataset is based on Tesla’s quarterly “Autopilot safety” report, which is known to be misleading.
There are three major problems with these reports:
- Methodology is self‑reported. Tesla counts only crashes that trigger an airbag or restraint; minor bumps are excluded, and raw crash counts or VMT are not disclosed.
- Road type bias. Autopilot is mainly used on limited‑access highways—already the safest roads—while the federal baseline blends all road classes. Meaning there are more crashes per mile on city streets than highways.
- Driver mix & fleet age. Tesla drivers skew newer‑vehicle, higher‑income, and tech‑enthusiast; these demographics typically crash less.
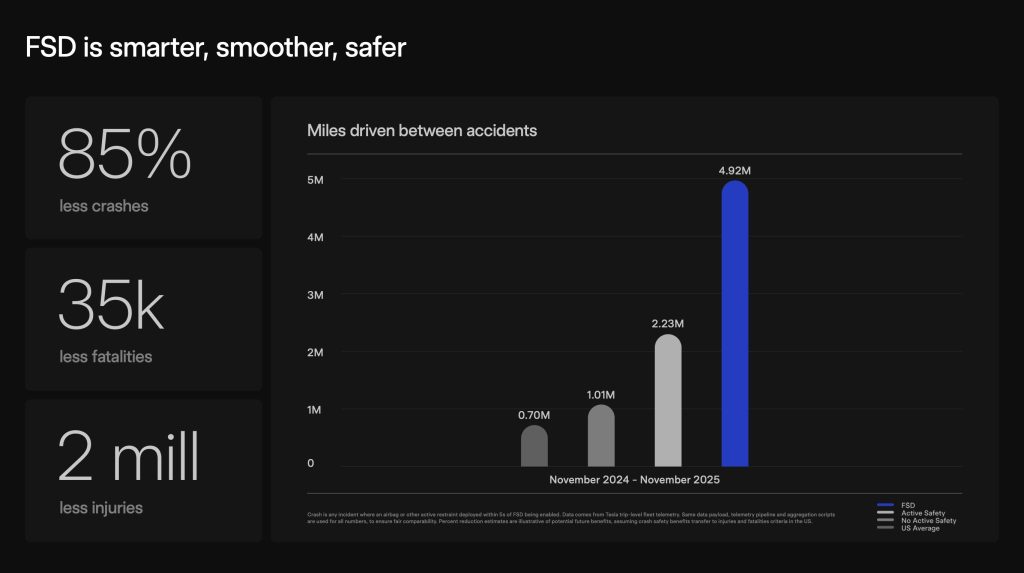
With the new chart on the right above, Tesla appears to have separated Autopilot and FSD mileage, which gives us a little more data, but it still has all the same problems listed above, except the road-type bias is less pronounced, since FSD is also used on city streets.
However, many FSD drivers choose not to engage FSD in potentially dangerous or more difficult situations, especially in inclement weather, which contributes to many crashes – crashes that are counted in the human driver data Tesla is comparing itself against.
Lastly, it is unfair to say that the data proves FSD is safer than human drivers, as even with the flawed data, Tesla should claim that FSD with human supervision is safer than human drivers. It’s not FSD versus humans, it’s FSD plus humans versus humans.
It leads us to this.
With Tesla and Musk being undoubtedly wrong and misleading about the performance and the very nature of its current autonomous driving offering, I wanted to know your opinion about the situation through this poll:
Electrek’s Take
Personally, I think it’s a little of both.
I think he sometimes really believes Tesla is on the verge of solving autonomy, but at the same time, he is perfectly willing to cross the line and mislead people into thinking Tesla is further ahead than it actually is.
For example, I believe I can explain this comment about Waymo having “rookie numbers” despite the Alphabet company having about 10x more “robotaxis” than Tesla – even with Tesla’s very loose definition of a robotaxi.
Based on job listings across the US and his recent ridiculous comment that Tesla will magically cover half of the US population with robotaxis by the end of the year, I think Tesla is hiring thousands of drivers. Soon, it will put them in Model Ys with ‘Robotaxi’ stickers on them and have them drive on FSD and give rides in the Robotaxi app in several US cities.
Musk will claim that Tesla’s Robotaxi is now bigger than Waymo, even though it will basically be the equivalent of Uber drivers in Tesla cars with FSD, which is already the case. Just this week, I took an Uber from the Montreal airport, and it was in a Model Y with FSD. Has Tesla launched ‘Robotaxi’ in Montreal?
It’s either that or he counts consumer vehicles with FSD, which is even dumber.
In short, he is delusional, and when he realizes that he was wrong, he is willing to lie to cover things up.
FTC: We use income earning auto affiliate links. More.


Sir Keir Starmer and Rachel Reeves have scrapped plans to break their manifesto pledge and raise income tax rates in a massive U-turn less than two weeks from the budget.
The decision, first reported in the Financial Times, comes after a bruising few days which has brought about a change of heart in Downing Street.
I understand Downing Street has backed down amid fears about the backlash from disgruntled MPs and voters.
The Treasury and Number 10 declined to comment.
The decision is a massive about-turn. In a news conference last week, the chancellor appeared to pave the way for manifesto-breaking tax rises in the budget on 26 November.
She spoke of difficult choices and insisted she could neither increase borrowing nor cut spending in order to stabilise the economy, telling the public “everyone has to play their part”.
‘Aren’t you making a mockery of voters?’
The decision to backtrack was communicated to the Office for Budget Responsibility on Wednesday in a submission of “major measures”, according to the Financial Times.
Tory shadow business secretary Andrew Griffith said: “We’ve had the longest ever run-up to a budget, damaging the economy with uncertainty, and yet – with just days to go – it is clear there is chaos in No 10 and No 11.”
This breaking news story is being updated and more details will be published shortly.
Please refresh the page for the fullest version.
You can receive Breaking News alerts on a smartphone or tablet via the Sky News App. You can also follow @SkyNews on X or subscribe to our YouTube channel to keep up with the latest news.

Solar and wind are growing fast enough to meet all new electricity demand worldwide for the first three quarters of 2025, according to new data from energy think tank Ember. The group now expects fossil power to stay flat for the full year, marking the first time since the pandemic that fossil generation won’t increase.
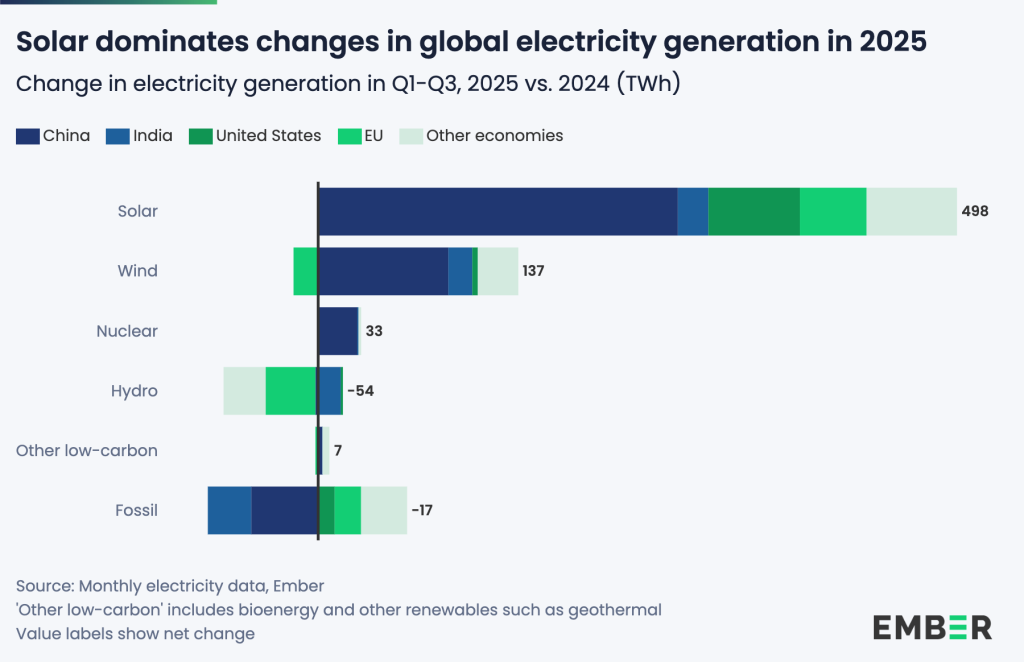
Solar and wind aren’t just expanding; they’re outpacing global electricity demand itself. Solar generation jumped 498 TWh (+31%) compared to the same period last year, already topping all the solar power produced in 2024. Wind added another 137 TWh (+7.6%). Together, they supplied 635 TWh of new clean electricity, beating out the 603 TWh rise in global demand (+2.7%).
That lifted solar and wind to 17.6% of global electricity in the first three quarters of the year, up from 15.2% year-over-year. That brought the total share of renewables in global electricity – solar, wind, hydro, bioenergy, and geothermal – to 43%. Fossil fuels slid to 57.1%, down from 58.7%.
Renewables are beating coal
For the first time in 2025, renewables collectively generated more electricity than coal. And fossil generation as a whole has stalled. Fossil output slipped slightly by 0.1% (-17 TWh) through the end of Q3. Ember expects no fossil-fuel growth for the full year, driven by clean power growth outpacing demand.
China and India are partly driving that shift. In China, fossil generation fell 52 TWh (-1.1%) as clean energy met all new demand, resulting from a structural change in its power system. India saw fossil generation drop 34 TWh (-3.3%), thanks to record solar and wind growth and milder weather.
Solar is leading the charge
Solar is doing the heavy lifting. It’s now the single biggest driver of change in the global power sector, with growth more than three times larger than any other electricity source in the first three quarters of the year.
“Record solar power growth and stagnating fossil fuels in 2025 show how clean power has become the driving force in the power sector,” said Nicolas Fulghum, senior data analyst at Ember. “Historically a growth segment, fossil power now appears to be entering a period of stagnation and managed decline. China, the largest source of fossil growth, has turned a corner, signaling that reliance on fossil fuels to meet growing power demand is no longer required.”
Electricity demand rose 2.7% in the first three quarters of 2025, far slower than the 4.9% jump seen last year when extreme heatwaves pushed up cooling demand in China, India, and the US. This year’s milder weather helped take some pressure off the grid, making it easier for clean energy to close the gap.
A turning point for the global power system
For the first time outside of major crises such as the pandemic or the global financial crash, clean energy growth has not only kept up with demand but surpassed it. The next big question: can solar, wind, and the rest of the clean power sector keep up this pace consistently? If they can, 2025 may be remembered as the year global fossil generation plateaued.
Read more: FERC: For two years straight, solar leads new US power capacity

If you’re looking to replace your old HVAC equipment, it’s always a good idea to get quotes from a few installers. To make sure you’re finding a trusted, reliable HVAC installer near you that offers competitive pricing on heat pumps, check out EnergySage. EnergySage is a free service that makes it easy for you to get a heat pump. They have pre-vetted heat pump installers competing for your business, ensuring you get high quality solutions. Plus, it’s free to use!
Your personalized heat pump quotes are easy to compare online and you’ll get access to unbiased Energy Advisors to help you every step of the way. Get started here. – *ad
FTC: We use income earning auto affiliate links. More.
-
 Sports2 years ago
Story injured on diving stop, exits Red Sox game
-
 Sports3 years ago
‘Storybook stuff’: Inside the night Bryce Harper sent the Phillies to the World Series
-
 Sports2 years ago
Game 1 of WS least-watched in recorded history
-
 Sports3 years ago
Button battles heat exhaustion in NASCAR debut
-
 Sports3 years ago
MLB Rank 2023: Ranking baseball’s top 100 players
-
Sports4 years ago
Team Europe easily wins 4th straight Laver Cup
-
 Environment2 years ago
Japan and South Korea have a lot at stake in a free and open South China Sea
-
 Environment1 year ago
Here are the best electric bikes you can buy at every price level in October 2024