
NREL Researchers Point Toward Energy Efficiency Instead of Long-Term Storage
Incorporating energy efficiency measures can reduce the amount of storage needed to power the nation’s buildings entirely with renewable energy, according to analysis conducted by researchers at the U.S. Department of Energy’s (DOE’s) National Renewable Energy Laboratory (NREL).
As more communities plan to eventually rely on 100% renewable energy, the researchers offer a strategy that could guide their paths — one that shifts away from long-duration storage.
“Minimizing long-duration storage is a key element in trying to achieve the target cost-effectively,” said Sammy Houssainy, co-author with William Livingood of a new paper that outlines an approach to 100% renewables. The research paper, “Optimal Strategies for a Cost-Effective and Reliable 100% Renewable Electrical Grid,” appears in the Journal of Renewable and Sustainable Energy.
The researchers considered solar and wind as the source of renewable energy, given that most plans for meeting the 100% target take those into account. They also used the Department of Energy’s EnergyPlus and OpenStudio building energy modeling tools to simulate energy demand, considering such factors as building size, age, and occupancy type. Data from the U.S. Energy Information Administration informed the scientists about the existing building stock characteristics and energy load used by the buildings.
Further, the researchers separated the country into five climate zones, ranging from the hot and humid (Tampa, Florida) to the very cold (International Falls, Minnesota). The other zones encompassed the cities of New York, El Paso, and Denver. Knowing the extremes of heating and cooling demands in each zone enabled the researchers to select the appropriate mix of renewable power sources to minimize any needed storage.
While varying definitions exist in the literature, for purposes of this study the researchers define long-duration storage as energy storage systems that meet electricity demands for more than 48-hour durations. Therefore, long-duration energy storage provides power days or months after the electricity is generated. However, most long-duration storage technologies are either immature or not available everywhere. The two NREL researchers calculated reaching the last 75% to 100% of renewable energy would result in significant increases in costs associated with long-duration energy storage. Instead of focusing on storage, the researchers emphasized the optimal mix of renewable resources, oversized generation capacities, and investments in energy efficiency. The researchers note that multiple pathways exist to reach 100% renewable and, as the costs and performance of technologies change, new pathways will emerge, but they identified a key pathway that is achievable today.
They also determined that oversizing renewable capacities by a factor of 1.4 to 3.2 and aiming for 52% to 68% in energy savings through building energy-efficiency measures lead to cost-optimal paths depending on region of the country. Houssainy said making homes and offices more energy efficient reduces the amounts of renewable resources needed, decreases the amount of storage, and cuts transmission costs, ultimately supporting the implementation of a carbon-free energy system.
“What’s included in the paper is really a multistep process to follow,” Livingood said. “That process is applicable to large cities, as well small cities. Now, the end result will change, city to city, as this multistep process is followed to cost-optimally achieve the target.”
For example, Tampa would generate all of its electricity from solar panels, while International Falls would receive 100% from wind turbines, the researchers calculated, in order to have the least reliance on storage.
“It is not intended to replace the need for site-specific, detailed engineering design and planning processes for buildings, electric grid, and energy infrastructure,” Livingood said, “but we believe that our novel calculation methodology yields overarching concepts and conclusions that are broadly relevant and applicable. For cost-effectively achieving 100% renewable scenarios, our newly developed calculation methodology provides general principles that help guide these detailed engineering design and planning processes.”
DOE’s Building Technologies Office funded the research, under the advisement of Andrew Burr (formerly DOE).
NREL is the U.S. Department of Energy’s primary national laboratory for renewable energy and energy efficiency research and development. NREL is operated for DOE by the Alliance for Sustainable Energy LLC.
Article courtesy of National Renewable Energy Laboratory.
Appreciate CleanTechnica’s originality? Consider becoming a CleanTechnica Member, Supporter, Technician, or Ambassador — or a patron on Patreon.


Environment
World’s largest oil company Aramco reports higher third-quarter net profit on production boost


A $5.7B lawsuit filed in Federal court alleges that Toyota operated what amounts an organized, fraudulent enterprise that intentionally concealed known, catastrophic safety defects associated with their hydrogen fuel cell-powered Toyota Mirai sedans.
Originally passed as part of the Organized Crime Control Act of 1970, the Racketeer Influenced and Corrupt Organizations (RICO) Act is designed to help prosecutors go after people or companies that commit a pattern of crimes as part of an ongoing organization or enterprise — like the Mafia (which doesn’t exist), or large-scale fraud operations at a corporation.
That RICO statute is now at the center of a new case against Toyota. In it, the plaintiff’s attorneys argue that Toyota knowingly engaged in a decade of fraud surrounding the hydrogen fuel cell-powered MIrai sedan that jeopardized public safety and breached the terms of a previous DOJ settlement.
The case, filed by Jason M. Ingber, lead attorney for the plaintiffs in the US District Court for the Central District of California, is a 142-page RICO complaint alleging that Toyota, its financing arm, and its California dealerships coordinated conspired to market and finance HFCEVs that technicians allegedly referred to as, “ticking hydrogen bombs.”
“This lawsuit isn’t about a simple defect, it’s about organized fraud,” argues Mr. Ingber. “Toyota engineered, financed, and controlled California’s hydrogen network, then used that control to hide safety failures and financial harm to consumers.”
According to the complaint, Toyota and its hydrogen partner, FirstElement Fuel (True Zero), intentionally concealed evidence of:
- hydrogen leaks near hot engine components, creating explosion risks
- sudden power loss, acceleration, and braking failures leading to collisions and injuries
- a collapsing hydrogen infrastructure, leaving drivers stranded for weeks without access to fuel
- aggressive financial collection tactics by Toyota Motor Credit Corporation, targeting owners of inoperable vehicles.
The suit further argues that Toyota’s concealment of these facts violates a 2014 Deferred Prosecution Agreement with the US Department of Justice (DOJ), in which the company admitted to concealing safety defects surrounding the highly publicized incidents of unintended-acceleration and agreed to report all (emphasis mine) future safety issues truthfully.
Ingber is seeking treble damages for the class, injunctive relief, and a federal order halting Toyota’s hydrogen enterprise, citing a continuing pattern of mail and wire fraud.
“Toyota built its reputation on trust,” Ingber said, in a statement. “Our case will show how that trust is violated and why consumers deserve accountability now.”
The case is titled Aminah Kamran et al. v. Toyota Motor Corporation et al., and is docketed as Case No. 2:25-cv-09542.
Electrek’s Jo’s Take
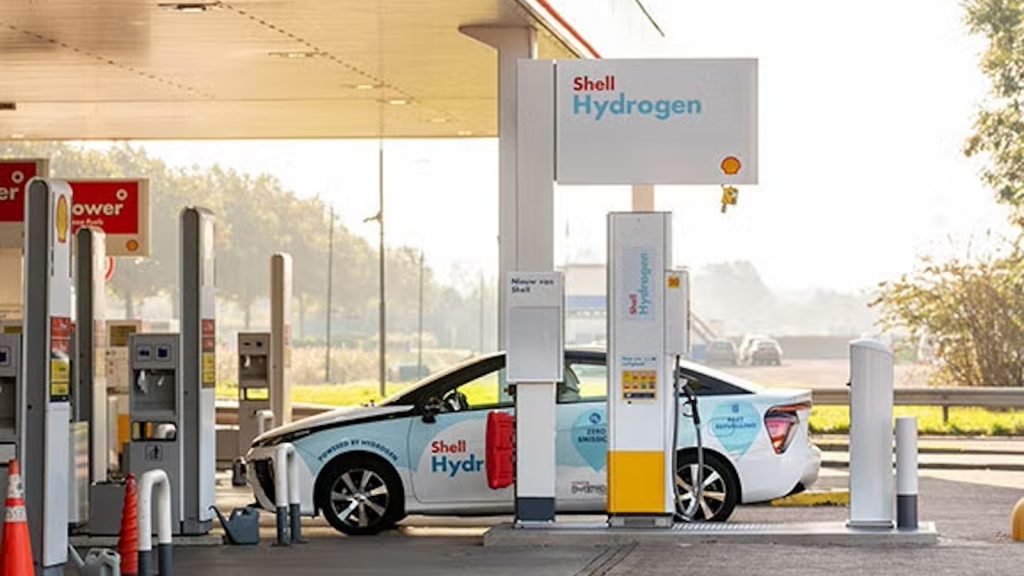
Despite the ebb and flow of media chatter about hydrogen fuel, the simple fact is that America’s hydrogen infrastructure isn’t, and what little infrastructure we did have took a hit last January, when Shell abruptly closed its publicly-accessible charging stations. That left precious few open and operational hydrogen stations available for public use – and the ones that are open don’t seem to be reliable, with Car Complaints reporting that Toyota Mirai owners say they can’t find working hydrogen refueling stations while others complained they had to park their cars for weeks because they couldn’t find hydrogen.
As a result, with supply issues impacting the few stations that are still available (see the DOE’s Alternative Fuels Data Center map, below), it’s tough to argue that Mirai buyers may not have gotten what they were expecting – regardless of the killer, 50% off plus $15,000 in free hydrogen fuel deals that were being offered.
Loading alternative fueling station locator…
SOURCE | IMAGES: CBS News, via CarScoops; Car Complaints.

If you’re considering going solar, it’s always a good idea to get quotes from a few installers. To make sure you find a trusted, reliable solar installer near you that offers competitive pricing, check out EnergySage, a free service that makes it easy for you to go solar. It has hundreds of pre-vetted solar installers competing for your business, ensuring you get high-quality solutions and save 20-30% compared to going it alone. Plus, it’s free to use, and you won’t get sales calls until you select an installer and share your phone number with them.
Your personalized solar quotes are easy to compare online and you’ll get access to unbiased Energy Advisors to help you every step of the way. Get started here.
FTC: We use income earning auto affiliate links. More.

Solar and wind together accounted for 88% of new US electrical generating capacity added in the first eight months of 2025, according to data just released by the Federal Energy Regulatory Commission (FERC) which was reviewed by the SUN DAY Campaign. In August, solar energy alone provided two-thirds of the new capacity, marking two consecutive years in which solar has led every month among all energy sources. Solar and wind each added more new capacity than natural gas did. Within three years, the share of all renewables in installed capacity may exceed 40%.
Solar was 73% of new generating capacity YTD
In its latest monthly “Energy Infrastructure Update” report (with data through August 31, 2025), FERC says 48 “units” of solar totaling 2,702 megawatts (MW) came online in August, accounting for 66.4% of all new generating capacity added during the month. That represents the second-largest monthly capacity increase by solar in 2025, behind only January when 2,945 MW were added.
The 505 units of utility-scale (>1 MW) solar added during the first eight months of 2025 total 19,093 MW and accounted for 73.4% of the total new capacity placed into service by all sources.
Solar has now been the largest source of new generating capacity added each month for two consecutive years, between September 2023 and August 2025. During that period, total utility-scale solar capacity grew from 91.82 gigawatts (GW) to 156.20 GW. No other energy source added anything close to that amount of new capacity. Wind, for example, expanded by 11.16 GW while natural gas’ net increase was just 4.36 GW.
Renewables were 88% of new capacity added YTD
Between January and August, new wind has provided 3,775 MW of capacity additions – more than the new capacity provided by natural gas (3,095 MW). Wind thus accounted for 14.5% of all new capacity added during the first eight months of 2025.
For the first eight months of 2025, the combination of solar and wind (plus 4 MW of hydropower and 3 MW of biomass) accounted for 88.0% of new capacity, while natural gas provided just 11.9%. The balance of net capacity additions came from oil (20 MW) and waste heat (17 MW).
Solar + wind are almost 25% of US utility-scale generating capacity
Utility-scale solar’s share of total installed capacity (11.62%) is now almost equal to that of wind (11.82%). If recent growth rates continue, utility-scale solar capacity should equal and probably surpass that of wind in the next “Energy Infrastructure Update” report published by FERC.
Taken together, wind and solar make up 23.44% of the US’s total available installed utility-scale generating capacity.
Moreover, almost 29% of US solar capacity is in the form of small-scale (e.g., rooftop) systems that are not reflected in FERC’s data. Including that additional solar capacity would bring the share provided by solar + wind to more than a quarter of the US total.
With the inclusion of hydropower (7.59%), biomass (1.06%), and geothermal (0.31%), renewables account for a 32.40% share of total US utility-scale generating capacity. If small-scale solar capacity is included, renewables make up more than one-third of total US generating capacity.
Solar is still on track to become the No. 2 source of US generating capacity
FERC reports that net “high probability” net additions of solar between September 2025 and August 2028 total 89,953 MW – an amount almost four times the forecast net “high probability” additions for wind (23,223 MW), the second fastest-growing resource.
FERC also foresees net growth for hydropower (566 MW) and geothermal (92 MW), but a decrease of 126 MW in biomass capacity.
Meanwhile, natural gas capacity is projected to expand by 8,481 MW, while nuclear power is expected to add just 335 MW. In contrast, coal and oil are projected to contract by 23,564 MW and 1,581 MW, respectively.
Taken together, the new “high probability” net capacity additions by all renewable energy sources over the next three years – i.e., the Trump Administration’s remaining time in office – would total 113,708 MW. On the other hand, the installed capacity of fossil fuels and nuclear power combined would shrink by 16,329 MW.
Should FERC’s three-year forecast materialize, by early fall 2028, utility-scale solar would account for 17.1% of installed U.S. generating capacity, more than any other source besides natural gas (40.0%). Further, the capacity of the mix of all utility-scale renewable energy sources would exceed 38%. Including small-scale solar, assuming it retains its 29% share of all solar, could push renewables’ share to over 41%, while natural gas would drop to about 38%.
“Notwithstanding impediments created by the Trump Administration and the Republican-controlled Congress, solar and wind continue to add more generating capacity than fossil fuels and nuclear power,” noted the SUN DAY Campaign’s executive director Ken Bossong. “And FERC foresees renewable energy’s role expanding in the next three years while the shares provided by coal, oil, natural gas, and nuclear all contract.”
Read more: EIA: Solar + storage dominate, fossil fuels stagnate to August 2025

The 30% federal solar tax credit is ending this year. If you’ve ever considered going solar, now’s the time to act. To make sure you find a trusted, reliable solar installer near you that offers competitive pricing, check out EnergySage, a free service that makes it easy for you to go solar. It has hundreds of pre-vetted solar installers competing for your business, ensuring you get high-quality solutions and save 20-30% compared to going it alone. Plus, it’s free to use, and you won’t get sales calls until you select an installer and share your phone number with them.
Your personalized solar quotes are easy to compare online and you’ll get access to unbiased Energy Advisors to help you every step of the way. Get started here.
FTC: We use income earning auto affiliate links. More.
-
 Sports2 years ago
Story injured on diving stop, exits Red Sox game
-
 Sports3 years ago
‘Storybook stuff’: Inside the night Bryce Harper sent the Phillies to the World Series
-
 Sports2 years ago
Game 1 of WS least-watched in recorded history
-
 Sports3 years ago
Button battles heat exhaustion in NASCAR debut
-
 Sports3 years ago
MLB Rank 2023: Ranking baseball’s top 100 players
-
Sports4 years ago
Team Europe easily wins 4th straight Laver Cup
-
 Environment2 years ago
Japan and South Korea have a lot at stake in a free and open South China Sea
-
 Environment1 year ago
Here are the best electric bikes you can buy at every price level in October 2024